
(This article is re-formatted from the following publication:
Mustacich, Robert V. 2020. The Computer Analysis of Die Cut Separations of U.S. Stamps
Proceedings of the Fourth International Symposium on Analytical Methods in Philately,
Washington, D.C., Thomas Lera, John Barwis, editors, November 13-14, 2020, pp. 47-58)
The Computer Analysis of Die Cut Separations of U.S. Stamps
By Robert Mustacich
Abstract
This paper describes a method for fully characterizing the profile of the serpentine die cut edges of self-adhesive stamps. Prior to this work, only gauge measurements and visual observations have been used to describe die cut edges of stamps. The method presented analyzes each peak and valley of the serpentine shapes to capture the variability in a die cut, and also provides averaged results such as the familiar gauge measurement. By fitting the arcs of circles to the separate peaks and valleys, the die cuts are characterized by radii and the locations of their circle centers, in addition to height and gauge. The measurement precision of these features from scanned images is several microns (thousandths of a millimeter), and the standard deviation of gauge measurement is ± 0.001 gauge unit. For the U.S. stamps analyzed, the trends of these different features by year and producer suggest the emergence of preferred designs. Beyond providing a generalized forensic capability, the method demonstrates the ability to detail anomalies in die cuts, along with the ability to fingerprint die cuts based on the existence of irregularities. Using this process, collectors can characterize and make precise comparisons with reference stamps in the event that the authenticity of a die cut stamp is in question.
Introduction
The commercial production of U.S. postage stamps began to transition to self-adhesive stamps in the late 20th century, and the separation of stamps correspondingly transitioned from perforation to die cutting. Die cutting offers speed and convenience using die mats attached to cylinders, leading to better integration with printing and production equipment. The die mats are very thin, and they can be manufactured by different methods (Nazar, 2013). Like the early stamp perforation process, designs for die cuts went through a period of experimentation and evolution toward designs resulting in ease of separation, durability, and ease of manufacture.
The production of die cut stamps in the U.S. involved a variety of contractors with an eventual phase-out of government production. Over the time period studied, 1995 to 2016, there is also a reduction in the number of contractors producing die-cut stamps. This study characterizes and compares die cutting features done by the government and the different contractors.
The feature characterization methods and results in this paper provide a foundation for forensic assessment of die cut stamps. Proliferation of die cutting machinery for the commercial production of labels and stickers has greatly spread the same technology used to produce modern stamps (Wista, 2019). However, because of the micron precision of the image analysis methods, the ability of a counterfeiter to match genuine die cuts should be very difficult. It is likely that counterfeits of die cut, self-adhesive stamps will continue to grow (Snee, 2017). The ability to more fully characterize die cuts as presented in this paper may become important as the printing techniques of the counterfeiters improve.
A brief comment on terminology. We philatelists are accustomed to referring most often to “perforations,” “perforation gauge” and similar terms. The standard practice with die cut stamps is to similarly describe them by gauge, now referring to the number of peaks or valleys in a 20 mm length of edge.
Measurement Method
Die cut separations are generally “serpentine,” having the appearance of a continuous wave. While it is straightforward to estimate the gauge of a die cut stamp’s edge using a standard perforation gauge, the small gauge differences between some can be more challenging to measure. Further, the use of a perforation gauge does not characterize the particular shape of a die cut edge.
While many die cut edges appear approximately sinusoidal, the shapes range from very rounded to more triangular. A sine wave, a standard trigonometric shape, can be mathematically fit to any regular periodic shape, but this procedure does not provide any description of the shape, other than perhaps a statistical measure of how well the sine wave fits the image of the edge. For this reason, I have developed a description for die cut edges in which separate circular arcs are mathematically fit to the individual peaks and valleys without being constrained to match the gauge. This essentially “floats” the location of each peak and valley for a comprehensive analysis that captures any variations in the die cuts. The result provides a full description of the shape of the die cut edge in addition to measurement of gauge and height. For example, die cut edges having more triangular shapes would have smaller arcs fit the more pointed peaks and valleys. In addition, this approach also accommodates variation in shape, and by capturing irregularities it creates the possibility of fingerprinting die cut edges. For simplicity in the remainder of this article, I will refer to a die cut edge simply as a “die cut.”
Figure 1. Illustration of a die cut stamp edge analyzed as a separate series of circular arcs. The serpentine shape (image data in blue) has a peak-to-peak length (L), which divided into 20 mm is the gauge. The average height (H), the radii (RP and RV) of the separate arcs fit to the peaks and valleys, the offsets (OP and OV) from the dashed center line of the circular arc centers (“+” marks) provide a characterization of the shape of the die cut. The first arc fit to the left-most peak is illustrated with a dashed red arc. Using a scanned image of a die cut, the analysis requires less than 1 second of computer time. This example shows the familiar case in which the peak and valley radii are nearly equal.
Figure 1 illustrates a die cut consisting of semicircular peaks and valleys. A centerline runs through the middle of the die cut dividing the edge into these peaks and valleys. The “+” marks indicate the centers of circles having arcs that provide the best fit to the respective peaks and valleys. The centers of these arcs may lie above or below the horizontal center line depending on the shape of the die cut. The dashed red line illustrates the circular arc fit to the first peak on the left. Each arc fit has its own radius measure, labeled in Figure 1 as RP and RV for the first peak and valley on the left.
For the first peak in Figure 1, its maximum distance from the horizontal axis is the radius minus the offset of the center of the fitted arc, RP – OP. If the offset is to the same side of the centerline as the peak, the maximum peak height will instead be RP + OP. The sum of the average of the upper and of the lower maximum distances provides the average height (H). For the situation of the relatively shallow serpentine shape shown in Figure 1, the offsets are subtractive and give a reduced value of the height. Because of the symmetry generally observed in die cut serpentines, the peak and trough offsets are similar in size and opposite in direction, one being below and the other being above the centerline. Analogous to the usual depictions of wave forms in physics, H would be the wave height, and the wavelength (L) is the peak-to-peak (or trough-to-trough) distance as called out in Figure 1. The gauge, G, commonly used by stamp collectors is equal to 20/L where L is expressed in millimeters.
I previously published an example of the analysis of a die cut using circular arc fitting (Mustacich, 2016). The computer methods for fitting circular arcs to image data are identical to the methods I have used previously to analyze perforations (Mustacich, 2014).
The overall method I used is I scanned the stamp image in positive monochrome film mode at 2400 dpi to a TIFF image file using a Canon 9000F flatbed scanner. I affixed die cut stamps to a clear polypropylene sheet cut from an Avery Heavy Duty sheet protector. The stamps were placed face down directly on the platen (polypropylene sheet side up) with small weights on the stamps to ensure flatness on the platen. The edge shapes were extracted from the images using the same computer programming methods published previously in my analyses of perforations (Mustacich, 2014). Because it is impractical to align stamps in the scanner to be perfectly horizontal at high resolution, the analysis software fit a line through the data for the entire edge and then used the slope of this line to rotate the image to horizontal. This removed any tilt from the image.
The next task was to locate the approximate peaks and valleys in the image. I accomplished this by smoothing each point of the edge shape by averaging with the surrounding 50 data points. This smoothed shape accurately followed the general undulations of the shape. This average is shown in green in the analysis examples described later in this article. This smoothed curve provided a relatively noise-free shape for easily estimating the locations of the peaks and valleys. These estimated peak and valley positions were used to launch the same computer-based searches for the best circular arc fits to the local data as described previously (Mustacich, 2014). The fitted arcs are shown in analysis examples as red circles that are truncated at the centerline.
Three examples in Figure 2 of greatly differing die cuts demonstrate the robustness of this approach. The image data is in white, and the arc fits are in red. The centerline and the peak/valley estimating curve are both in green. The red ‘+’ marks are the circle centers of the fitted arcs. The number above the center mark is the arc radius in microns (thousandths of a mm), and the quality of fit value (Q) is a statistical measure of the error of the arc fit to the data (Mustacich, 2014). Good fits of arcs to the data give smaller statistical errors resulting lower values of Q.

Figure 2. Three die cut analyses showing the robustness of the analysis method to large differences in shape of the die cut. Most die cuts are like the top two examples and are intermediate between a semicircular and a more sinusoidal shape, and the circular arcs fit to the data closely. The bottom example is atypical and represents a more extreme situation, but the circular arcs nonetheless provide a good approximate description of the shape and height of the die cut.
The upper die cut example has a profile with nearly semicircular arc fits in which the arcs of the peaks nearly meet the arcs for the valleys. The second die cut example in Figure 2 is more sinusoidal in shape, and the narrower shapes have circular arc fits that do not quite meet each other at the centerline. The Q values for this case are slightly larger. The increased deviation from a circular shape is likely responsible for this small increase in error.
The bottom example is an extreme case of a relatively triangular die cut with rounded peaks and valleys. This type of serpentine cut has been referred to as a “wide teeth” variety (Blanks, 2010). There is a modest increase in the error of fit (a Q of 12-15), but the circular arcs fit much better than one might expect. The arcs remain centered about the peaks and valleys, and this results in precise gauge measurements. There is a small underestimation of H by 7% for this extreme case. Overall, the circular arc fits are quite close to the image data, even in this extreme example. Instead of forcing the entire edge to fit to a sine or other periodic wave formulation, this method has the flexibility to capture the variations in shape as well as asymmetry and local differences.
For this study I made a survey of die cuts by selecting about 20 different issues per year from 1995 through 2016 (see Appendix). I sought to obtain a wide selection of the different producers of die cuts over this period. All stamps were mint, carefully peeled from their backing, and applied to a transparent sheet for scanning as described above. Including all the die cut edges on each stamp provided a set of more than 1,280 different images of die cuts for this study. Stamps are occasionally referenced with Scott catalogue numbers to specify which variety of a stamp was used for study.
Information regarding the producers of die cuts was largely obtained from the Scott Specialized Catalogue of United States Stamps and Covers (Scott, 2017), Linn’s Yearbooks of U.S. stamps (Linn’s, 1995-2010), and other published literature. For stamp production contracted out by the Bureau of Engraving and Printing, I have associated the die cutting with the single contractor typically cited, unless there is information that states that the die cutting was done by a subcontractor. For example, Bank Corporation of America subcontracted the production of the 1999 33-cent Berries to Guilford Gravure, with die cutting done using a George Schmidt rotary die cutter (Smithsonian, 2019). These stamps are accordingly identified as a product of Guilford Gravure rather than a product of Bank Corporation of America.
Because of ownership changes among contractors, sometimes the new parent company is referenced in the literature, and sometimes the more familiar, wholly owned subsidiary is still referenced. An example is the acquisition of Bank Corporation of America by Sennett Security Products in 2004, and then Sennett Security Products by CCL Industries, Inc. in 2015. Throughout all of this, Bank Corporation of America is still cited as a stamp producer. Therefore, I have tried to be consistent with the citations from familiar sources, and only specify subcontractors for die cutting where it is clearly called out in reference materials. These are the die cutting contractors (and their subcontractors) to the Bureau of Engraving and Printing in this study: Avery Dennison, Bank Corporation of America, CCL Industries, Ashton Potter, American Packaging Corporation, Guilford Gravure, and Stamp Venturers.
I grouped the stamps into three categories for measurement purposes. These categories differ in how the horizontal and vertical die cuts intersect at the corners and where the fully formed peaks and valleys begin and end. In the most common variety (about 69% of the die cuts in this study), the die cuts depart slightly from their otherwise regular shapes near the stamp corners to intersect each other at approximately right angles, but with a tilt. Because of this tilt, I have termed these the “X” group, but it has also been termed “wavy die cut” (Blanks, 2005a). Opposite edges of a stamp are complimentary shapes. The X corner matches a peak with a valley, so these patterns repeat around the stamp in a clockwise manner.
A similar grouping that I have termed the “+” group does not have the tilt of the X group at its corners. This type of corner has also been termed “squared” (Blanks, 2005b). The horizontal and vertical die cuts meet at right angles at the corners, but there are variations in the length of the flattened portion of the die cut at the corners. This group is well represented, but less numerous in my survey than the X group.
A remaining small group is coil stamps distinguished by having straight edges on two opposite sides with a variety of die cuts on the other pair of sides. The die cuts can meet the corners of these coil stamps in a variety of ways.
Some of styles encountered in this survey are shown in Figure 3. Typical corners for the X group are shown by the top example of Figure 3, the 1999 1-cent American Kestrel. The Figure 3 die cut profiles have been labeled based on the stamp edges starting and ending with either peaks (P) or valleys (V) (Nazar, 2019). Thus, starting with a peak from the upper corner and ending with a valley would be termed “PV.” Figure 3 highlights the starting and ending peaks and valleys that I accepted for analysis. This may differ in some cases with the choices made for descriptive nomenclature for the stamps because I wish to exclude peaks or valleys near the corners that are rounded into and merge with the straighter cutting at the stamp corners. Excluding such peaks or valleys from the analysis makes the statistical comparisons and average values of the mostly identical appearing peaks and valleys in a die cut more meaningful. I have added dashed tangent lines to indicate locations where peak or valley shapes are compromised to merge with the corner profile.
The next three images in Figure 3 are variations of the + type, where approximate horizontal lengths are indicated after the “+” in millimeters. The profiles are from the die cuts from the 1999 33-cent Flag and City (Scott #3278), the 1996 32-cent Flag over Porch (Scott #2920D), and the 1997 32-cent Traditional Christmas. Approximately 20% of the die cuts in this study are the + type. The remaining five examples in Figure 3 are coils showing from top to bottom: rounded peak (RP); rounded (R); rounded with an approximately 1 mm horizontal length adjacent to the rounded corner (R1); an approximately linear intersection at an acute angle to the straight edge of the coil (an “X” variety (X) of a coil stamp); and the bottom example is a linear cut (C) which intersects the serpentine die cuts.

Figure 3. Varieties of die cuts encountered in this study. The shapes of the stamp corners differ in style, and my nomenclature is adapted from various references in the literature. Corner intersections of the die cuts are basically “square” which I have denoted as +, tilted which I have denoted X (the most common variety), rounded as in the case of many coil stamps, or simply an intersection with a straight cut C.
The die cuts for the above described coils are from the 1996 15-cent Auto Tail Fin, the 2012 25-cent Spectrum Eagle (Blue behind USA), the 1998 10-cent Eagle and Shield, the 2015 10-cent Stars and Stripes, and the 1997 Flag over Porch linerless coil (Scott #3133), respectively. What I refer to as rounded (R) types have also been termed “rounded shoulder” types (Blanks, 2005c). Various + types of coil stamps are also included in the study, and their corners are the same as those illustrated for non-coil stamps in the upper part of Figure 3. The coil stamps account for the remaining 11% of the die cuts in this study. The C variety in Figure 3 exhibits small paper remnants from gaps in the die cut, sometimes called “bridges.” Such bridges are very prominent in very early, hand-rouletted stamps as they helped prevent the sheets of unbacked paper stamps from falling apart (Linder & Dromberg, 1983).
Results
Most of the die cuts in this study have a slightly sinusoidal shape. This is demonstrated in Figure 4 which shows of plot of arc radius versus gauge for the 1,280 die cuts characterized in this study. A theoretical profile consisting of uniform, 180° semicircular arcs which adjoin perfectly at the centerline will have a length (L) equal to four times the radius (4·R). Substituting this into the gauge equation G=20/L gives the relationship R =20/(4·G) for this shape. Figure 4 shows this as a dashed line in the plot. Most of the data in Figure 4 is close to this line, but with a slightly smaller radius consistent with a more sinusoidal shape as in the second example in Figure 2. Note that there is a fair amount of data revealing larger than semicircular radii (data above the dashed line), a consequence of smaller heights that are best described with larger radius arcs having large offsets of the arc centers from the centerline. This point is developed further in the discussion of Figure 11.

Figure 4. A plot of average arc radius vs. gauge for 1,280 die cuts analyzed in this study. The dashed line R=20/(4·Gauge) shows the theoretical relationship for a die cut consisting of semicircles perfectly fit to the gauge. Most are approximately of this shape, but with smaller radii as in the second and third examples in Fig. 2.
This study found a small systematic deviation in the measured average radius when comparing peaks and valleys. This is easily demonstrated by taking a pair of stamps and measuring the features of the shared edges after separating the two stamps. When comparing the peaks of one die cut with the matching valleys of the other die cut, the peaks are typically smaller by about 0.01 mm in measured radius. The width of the cut made to separate the stamps appears to be ≤1 pixel (about 0.02 mm of resolution) when scanning pairs of stamps at 1200 dpi. This width of the cut in producing the die cut separation will increase the radius of the valley and decrease the radius of the matching peak by a small amount. While small optical artifacts could result in some shadowing or similar imperfections in image scanning, the expected effect of the cut width could well account for this small systematic deviation.
Because there are some cases in which the peak and valley radii of a die cut edge differ much more than this small amount, I report the upper and lower radii and their statistics separately. Indeed, there are cases in which the die cuts have differing peaks and valley shapes, and even varying sizes. This is presented in later examples in this paper. If comparing statistics from opposite sides of the stamp, one must keep in mind the complementarity of the stamp edges and the image rotation since the peaks of one side are the die cut valleys on the other, especially if there are significant asymmetries. Two early die cut stamps, Scott #3031 and #3031a, were noted in the scanned images to have approximately 0.05 mm of extra material attached to the teeth of the roulettes after separation of the stamps. This resulted in 0.05 mm larger peak radii than the complimentary valley radii on the adjacent stamps. Most stamp edges in the study had sharp die cuts free of debris with complimentary peak and valley sizes between adjacent stamps.
The variation of die cut parameters in comparing stamps taken from the same sheet is shown for some example issues in Table 1. Nonadjacent stamps were taken from the same sheet for three issues, identified by Scott numbering. Using nonadjacent stamps avoids the inclusion of any edges that are direct complements of other edges. The total number of horizontal and vertical edges measured for each issue is listed in the table, along with the average results. The standard deviations are included with the measurements. Also included in the final row of Table 1 is an estimate of the standard deviations of the measurement method. This was obtained by taking a single die cut and performing 15 different scans of the die cut, repositioning the stamp on the platen between scans. I have termed these results the “measurement variation” in the final row of the table.

Table 1. Standard deviations of measured features of die cuts. Stamps of three different issues were measured in quantity to determine the variability of the features. Non-adjacent stamps from the same sheet were used to avoid including complimentary die cuts. For reference, 15 repeat measurements of the same die cut, repositioned and rescanned for each measurement, are included as the “measurement variation.” The measurement variation demonstrates a high precision with standard deviations of the features in the micron range. The multiple die cuts taken from the sheets exhibit slightly more variation, still a high degree of uniformity.
The measurement variation in the final row of Table 1 is smaller than the otherwise small variation observed between stamps originating from the same sheet. This indicates that there are some differences in the die cutting that is likely the result of slight variation in the die mats.
The average standard deviation of the gauge in these examples is approximately 0.01 gauge unit, just one tenth of the 0.1 gauge unit resolution that is typically obtained with better quality visual gauges. The error in the process itself is only about 0.001 gauge unit, the result of mathematical curve fitting to get high precision peak positions along the die cut.
The average radii of the arc fits to the peaks are generally smaller than for the valleys. This accords with the expected effect of the cut width. The average difference is on the order of 0.01 mm, consistent with general observations of the difference between the peak and valley sizes for die mats. One presumes that the die mats have been designed to have equal peak and valley sizes.
The offsets, the positions of the circle centers of the arcs, typically mirror each other because of the symmetry of most die cuts, the sign indicating the direction from the centerline. While there is some variation in the radii and offsets of the arc fits to the die cuts, the combination of offsets and radii provides measures of the height with similar standard deviations. Overall, the data for these examples shows that the die cuts are quite uniform, and the small measurement variation indicates that they can be measured with a high degree of precision.
While most die cuts exhibit uniformity of gauge and symmetry of shape, there are some exceptions. Two examples of irregular die cuts encountered in this study are shown in Figure 5. The vertical die cuts of the 2006 24-cent Common Buckeye, right edge shown horizontally in the upper example, has a large gauge deviation at the midpoint of the stamp edge. A single radius of approximately 0.14 mm greater size occurs at this location. The die cut on either side of this inhomogeneity has uniform shape with a gauge of 11.0, but inclusion of this wider peak in the middle of the die cut creates a step in the otherwise uniform peak spacing. This large step has the effect of lengthening the edge when counting the number of peaks in a 20 mm length to determine gauge. Consequently, the gauge fit to the entire edge gives a lower value of 10.7. The Scott Specialized Catalogue listing for this stamp cites a gauge of 11, a value obtained only by measuring on one side or the other of the anomalous center feature of the edge. This stamp was produced in 2006 by Avery Dennison.
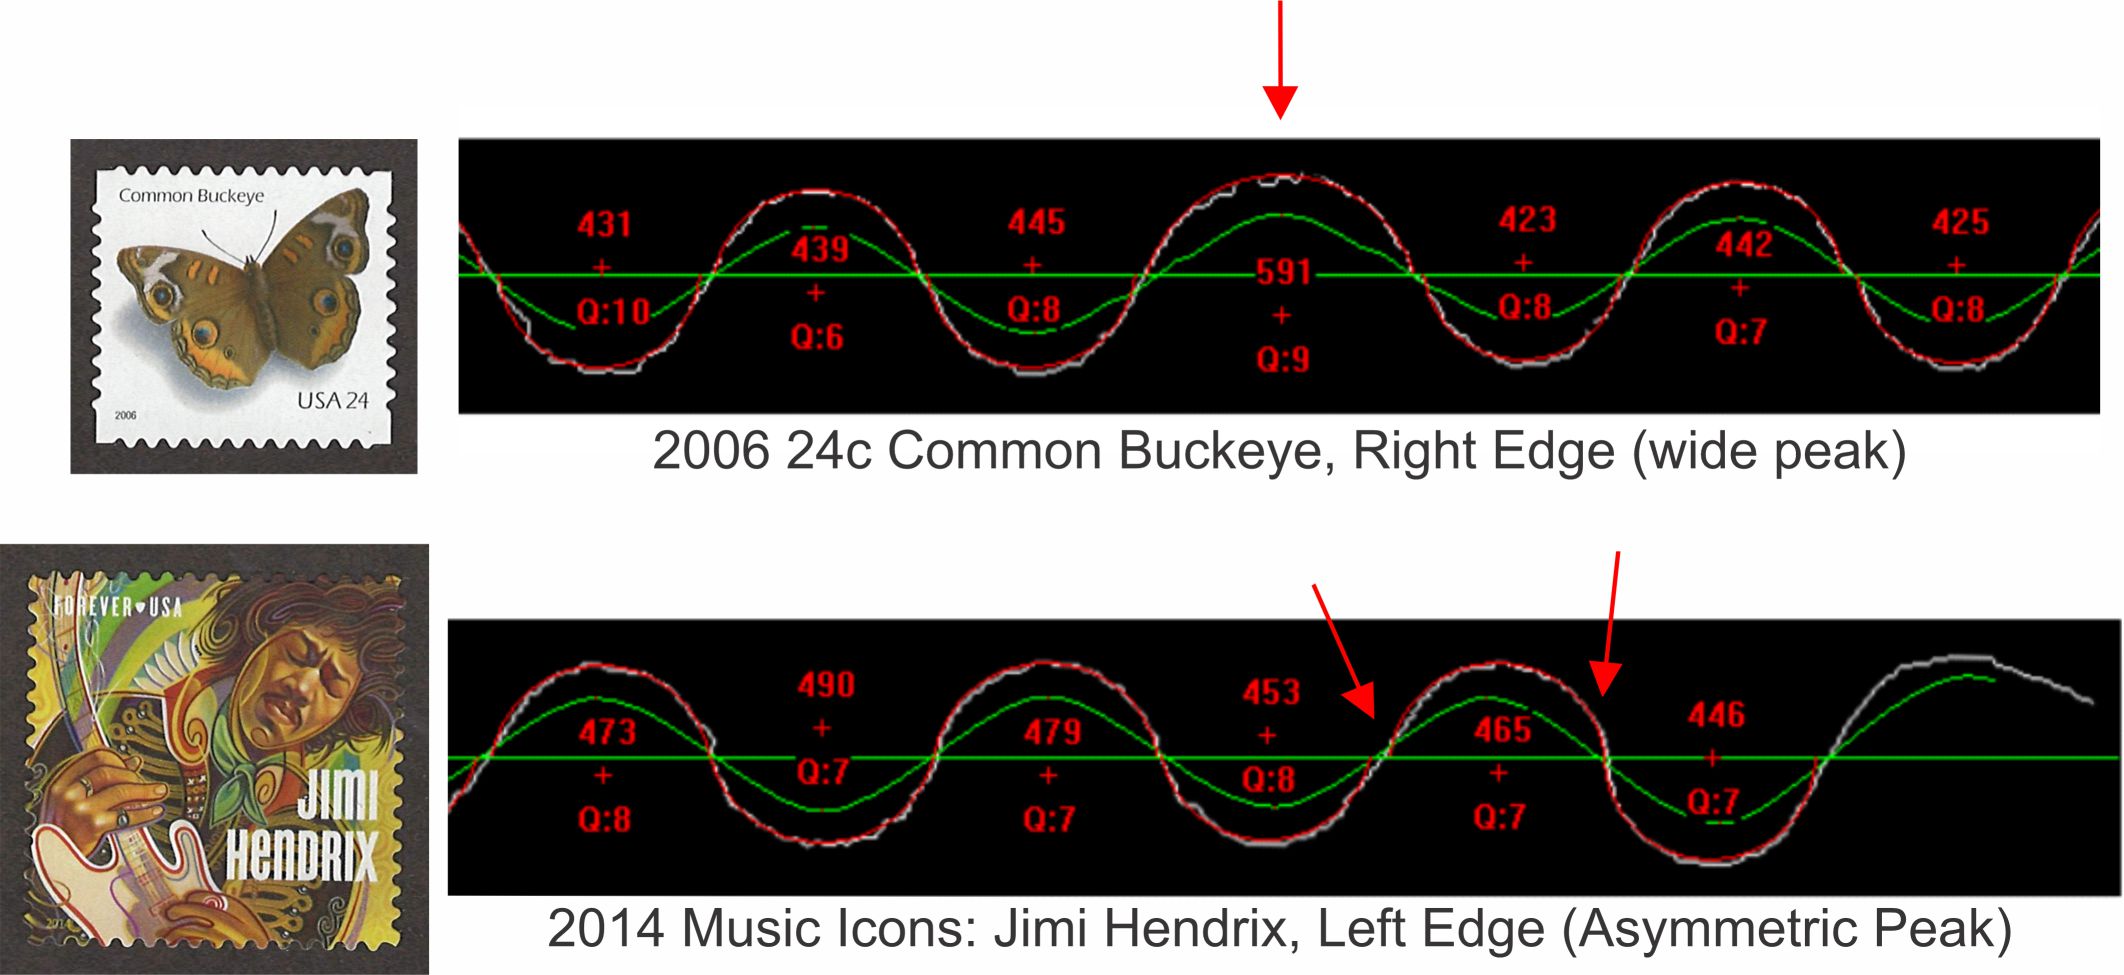
Figure 5. Two examples of anomalous die cut edges. The 24c Common Buckeye stamp of 2006 has one slightly wider peak in the middle of the right side of the die cut. Including this anomaly increases the gauge measurement compared to measuring on either side of it. The Music Icons: Jimi Hendrix stamp of 2014 has an unusual asymmetric peak shape near the top of the stamp as shown for the peak nearest the top edge on the left.
The lower example in Figure 5 shows the left edge die cut from 2014 Music Icons: Jimi Hendrix, turned horizontally, that exhibits an irregular shape near the corner of the stamp. There are three smaller radii (453, 465 and 446) with a large tilt present in the second of the three. This is most apparent in the angles the die cut makes with the centerline. The opposite side of the stamp has the complement to this irregular shape. Bank Corporation of America is reported to have produced this stamp in 2014.
For both of these anomalies we cannot conclude whether they are intentional security measures to allow better detection of potential counterfeits or if they are design compromises in the die cutting mats.
Gauge
Gauge is the only parameter that is commonly used to describe die cuts. The precision that is reported in the Scott Specialized Catalogue (Scott, 2017) is often in fractions of a gauge unit – ¼ of a gauge unit, or even tenths of a unit, and other times just to the nearest unit (but probably when closer to the unit than the nearest fractional value). For the 1,280 die cuts studied, gauge measurements were typically within 0.2 gauge unit of the stated value in the catalogue, with a standard deviation of 0.1 gauge unit. A few discrepancies surfaced, such as the 2011 EID Greetings forever stamp produced by Avery Dennison, and the 2015 Purple Heart 49-cent stamp produced by Bank Corporation of America for Sennett Security Products. The catalog lists gauge values of 11.25 and 11 for these two issues compared to my gauge measurements of 10.8 x 10.9 and 11.25 x 10.8, respectively.
Figure 6 shows plots of the gauges found for the three generic stamp types over the time period from 1995 to 2016, with the data points coded for each stamp producer. For all three types, there appears to be greater gauge variety in the early years of production. Most producers have engaged in repeated use of the same gauges, as evidenced by the horizontal repeats in the plots. This is likely the result of repeated use of the same tooling or design practices. A conspicuous exception is the X variety stamps produced by Bank Corp of America in 2001-2002. After 2004, most of the X variety stamps are of three approximate gauges: 10.5, 10.8, and 11.25. Less gauge variation is observed in the + varieties. This is also typical of coil stamps, and these are similarly limited to just a few gauges in the later years. Besides converging toward die cutting designs optimal for durability and separability, this may also be the result of a reduced number of contractors producing stamps, especially since they appear to reuse tooling or design processes. This may also reflect an insufficient sampling of the number of die cut stamps profiled in this study.

Figure 6. The gauges of die cuts by type, year and producer. It appears that producers generally continue to keep using their specific die cut profiles. There is also a relative narrowing of gauge selections in the later years. Data key: □ Bureau of Engraving & Printing (dark blue); ○ Avery Dennison (red); Δ Bank Corp. of America (green); X CCL Industries; ◊ Ashton Potter (orange); Δ American Packaging Corp (light blue); + Stamp Venturers; ○ Guilford Gravure (violet).
Height
The range of die cut heights for the three groups of stamps also narrows over time as shown in Figure 7. Again, there appears to be some narrowing by producers of the choices for heights, such as Avery Dennison’s production of the + group stamps to heights of 0.69 mm and 0.75 mm in 2013. The X group shows a wider range in height prior to 2006. Reduced variety because of fewer producers is evident in the plot of coil heights, but perhaps my sample of die cuts failed to reveal further variations.

Figure 7. The die cut height by type, year and producer. Like the gauge, there is a relative narrowing of height values in later years that is the result of several factors. Data key: □ Bureau of Engraving & Printing (dark blue); ○ Avery Dennison (red); Δ Bank Corp. of America (green); X CCL Industries; ◊ Ashton Potter (orange); Δ American Packaging Corp (light blue); + Stamp Venturers; ○ Guilford Gravure (violet).
For a serpentine shape consisting of identical 180o semicircles meeting at the centerline with no offset of the circle centers, the height is equal to twice the radius. Since the radius will be 20/(4·Gauge) in mm for this situation, the height will be 10/Gauge in mm. This represents an idealized maximum height based on the idea that yet greater heights with increasing radius would result in interlocking perforations for a constant gauge value. Height vs. gauge is plotted in Figure 8 for the three die cut types, and this idealized height for a semi-circular serpentine appears to provide an upper bound for the values of the die-cut heights for different gauge values. Some data lies near this boundary and represents die cuts with nearly semicircular peaks and valleys. Many of the stamps produced by BEP are close to the plot of Height = 10/Gauge in Figure 8.

Figure 8. Plots of height vs. gauge for the types of die cuts. The dashed lines show the value for the theoretical case of die cuts consisting of semicircles (Height = 10/Gauge). While a few die cuts have of a nearly semicircular shape, most have smaller height values. Data key: □ Bureau of Engraving & Printing (dark blue); ○ Avery Dennison (red); Δ Bank Corp. of America (green); X CCL Industries; ◊ Ashton Potter (orange); Δ American Packaging Corp (light blue); + Stamp Venturers; ○ Guilford Gravure (violet).
Radius
The trends observed in this survey for the radii fit to the peaks and valleys of die cuts are presented in Figure 9. Similar to the trends for gauge and height, the die cuts have radii that effectively have settled in on a few values over time, especially as the number of producers declined in recent years. The X group after 2005 has values that are approximately 0.45 mm, while the + group has similar values in addition to a few of approximately 0.65 mm. The coil group radii after 2010 in this survey are largely of three approximate values produced by three printers: 0.45 mm (Avery Dennison and Bank Corp. of America), 0.52 mm (Ashton Potter), and 0.55 mm (Ashton Potter).

Figure 9. The average radii of peaks and valleys in die cuts by type, year and producer. While there may be some narrowing of design choices, the narrowing in later years may be partly accounted for by the reduced number of producers. Data key: □ Bureau of Engraving & Printing (dark blue); ○ Avery Dennison (red); Δ Bank Corp. of America (green); X CCL Industries; ◊ Ashton Potter (orange); Δ American Packaging Corp (light blue); + Stamp Venturers; ○ Guilford Gravure (violet).
Because the limiting profile consisting of adjoining semicircles matching the gauge has the relationship of the height equal to twice the radius, it is interesting to examine plots of the height vs. radius for the three groups of die cuts. These plots are shown in Figure 10. In this figure the limiting Height = 2·Radius bounds are shown as dashed lines. The data near these bounds is very similar to the data near the same bounds presented in Figure 8. The verticality of data clusters away from the boundary lines in Figure 8 is mostly replaced with downward sloping trends (illustrated with lines drawn in the data) in Figure 10.

Figure 10. Plots of height vs. radius for die cut types. A profile consisting of joined semicircles is represented by the dashed lines (Height = 2·Radius), and a few die cuts have this shape. Lines are sketched through different groups of the same producer to suggest possible underlying relationships. Most stamps have heights that are less than the values required for a semicircular profile. Data key: □ Bureau of Engraving & Printing (dark blue); ○ Avery Dennison (red); Δ Bank Corp. of America (green); X CCL Industries; ◊ Ashton Potter (orange); Δ American Packaging Corp (light blue); + Stamp Venturers; ○ Guilford Gravure (violet).
The dense vertical cluster for the X group at about 10.8 gauge in Figure 8, is now a more diagonal cluster in Figure 10 as suggested by the line drawn through the cluster. This is more easily observed in the + group die cuts of gauge 11 produced by Avery Dennison in comparing the vertical cluster in Figure 8 with the more diagonal spread of this cluster in Figure 10. While the coil data is sparser, some similar differences can be found for some of the data in comparing Figures 8 and 10.
The sloping height vs. radius trends in Figure 10 can explained by a trade-off of height with radius while maintaining a constant gauge. A plot of the height vs. radius in the X group data having a gauge in the range of 10.72-10.78 is presented in Figure 11 along with some example plots of die cut analyses of points selected from the nearly linear spread of the data. This is illustrated in the upper right where arcs from three circles are overlapped to create a single peak for the same peak width (constant gauge) on the green line representing the centerline of a die cut. This relationship likely explains some of the linear relationships suggested in Figure 10.

Figure 11. A plot of height vs. radius for X-type die cuts having gauge values in the range of 10.72 to 10.78. A line drawn through the data highlights the linearity of this data. Profiles from different locations along this line reveal a tradeoff between larger radius and reduced height with arcs confined to this small range of gauge. This is illustrated in the upper right where arcs of different radius are constrained to the same gauge length along the green centerline through the die cut. This trade-off likely explains some of the linear relationships suggested in Figure 10.
Fingerprinting
Two types of fingerprinting of die cut stamp edges are clearly possible based on these research results. One is a generic fingerprint based on the overall characterization using the average edge features, and another is a full characterization of the sequence of the specific peaks and valleys along the edge. Because of the high precision in the software-based measurement of these features, either approach could be used for testing the relatedness and grouping of stamps.
The clustering of data that is observed in Figures 6-11 suggests that stamps can be subjected to overall characterization to see that their average features are in reasonable alignment with previously measured parameters such as gauge, average height, and the average radii of peaks and valleys. If the appearance of a die cut edge is peculiar, this level of generic characterization and comparison with other die cuts’ features would be advisable. Because of the very small amount of variation observed in the production of a stamp issue, as in the examples in Table 1, seemingly small differences might be significant. It would be important to gather reference examples of the same issue that have been used or handled similarly for comparison.
The characterization approach described in this paper could become increasingly useful if printing methods for counterfeit self-adhesive stamps continue to improve. A recent example is the counterfeit of the 2014 Flag and Fireworks coil stamps produced by offset lithography (Snee, 2017). While these counterfeits can be still be distinguished by small differences in the printing, the die cuts closely mimic those of the genuine stamp. The die cut is noted to differ by about 0.2 gauge unit, but this is the only familiar comparison method. An effort by the counterfeiter to match the die mats used in the production of the genuine stamps is likely to be very difficult given the precision with which the methods presented in this study can characterize a die cut.
A more detailed level of fingerprinting can also be pursued along the same lines as fingerprinting using the sequential pattern of perforation features (Mustacich, 2014). In this case, the sequence of peak and valley measurements is used to fingerprint the die cut. For example, the sequence of radii can be used to fingerprint the first example of atypical edges in Figure 5. The radius is plotted in Figure 12 according to the sequence of the arc fits for the left and right stamp edges, top to bottom. The large radius in the center position results in a larger value in the middle of the sequence. The separate fingerprints for the two edges show that the large deviation in radius overlays nearly perfectly in both position and size. These fingerprints would readily match using a simple computer program to align and match sequences. This is done by testing the range of possible sequence alignments to find alignments with minimum differences. While the typical variations of features in die cut stamps are small, possibly these are large enough to carry out pattern matching related to position on a sheet of die cut stamps, especially if there are a few anomalous features large enough to create a useful fingerprint. Table 1 reveals that die cut stamps can have standard variation a bit larger than the measurement variation of about ±0.003-0.005 mm. Thus, it may be possible to use fingerprinting sequences of radii or other features to match to specific positions on a die cut sheet that differ sufficiently. This is an open question for future research.

Figure 12. Alignment of the sequences of radii for the right and left edges of the 24c Common Buckeye stamp shown in Figure 5. A computer correlation of sequences of radii for different die cuts matches these together.
Summary
This study demonstrates the ability of computer-based analysis of scanned images to characterize the shape of die cuts by finding the best size and positioning of a circular arc to fit each peak and valley of the die cut profile along the edge of a stamp. This method has the flexibility to fit circular arcs to the full range of die cuts in the survey. This approach allows for irregularity of the peaks and valleys (including relatively triangular ones) and avoids limiting the peak and valley analysis to a single periodic waveform that is simply fit to the edge of the stamp. Letting the individual analysis of each peak and valley “float” independently still results in gauge measurement precision of about ± 0.001 gauge unit. Measurements of arc radii for peaks and valleys, arc offsets from center line, and heights all have standard deviations in the micron range. Once a die cut image has been scanned and cropped, the computer-based analysis requires less than a second.
A survey of 1,280 die cuts with respect to production year reveals the general characteristics used by different producers and how these have evolved over time. Within the sampling limits of this survey, there is a general trend toward fewer contract producers using their preferred gauges and die cut profiles. There is clustering of data around certain parameter choices, and this provides reference values expected for different producers at different times. These reference values can provide a basis for forensic examination of die cuts, and in the case of well-made counterfeits the precision of this characterization method may be very difficult to defeat regarding comparison with genuine die cuts.
Appendix
The specific U.S. stamps used for this study are listed in order of Scott Catalogue number as follows (duplicates noted parenthetically): 2915C, 2915D, 2920, 2920D, 2921, 3018, 3031, 3031A, 3049A, 3050, 3050A, 3052, 3052D, 3122, 3125, 3133, 3137, 3176, 3177, 3204, 3207, 3208, 3228, 3230, 3244, 3263, 3266, 3268, 3271, 3276, 3278, 3279, 3280, 3282, 3283, 3315, 3331, 3438, 3447, 3450, 3451, 3452, 3464, 3468A, 3470, 3475, 3477, 3482, 3484, 3485, 3496, 3497, 3498, 3499, 3501, 3522, 3526, 3534, 3548, 3549B, 3550, 3557, 3558, 3559, 3560, 3613, 3614, 3647, 3648, 3660, 3669, 3672, 3695, 3749A, 3750, 3754, 3755, 3756, 3756A, 3757, 3770, 3773, 3774, 3781, 3782, 3783, 3803, 3804, 3812, 3813, 3820, 3829, 3829A, 3830, 3832, 3833, 3835, 3836, 3838, 3839, 3854, 3862, 3863, 3869, 3870, 3871, 3872, 3874, 3875, 3876, 3877, 3879,3880, 3881, 3882, 3896, 3897, 3898, 3904, 3905, 3906, 3911, 3925, 3930, 3936, 3938, 3943, 3966, 3968, 3969, 3970, 3974 (2), 3975, 3978, 3980, 3982, 3983, 3985, 3995, 3996, 3998, 4001, 4001A, 4002, 4020, 4029, 4030, 4031, 4032, 4073, 4077, 4078, 4079, 4100, 4117, 4118, 4119, 4120, 4121, 4122, 4124, 4125, 4126, 4127, 4128, 4130, 4133 (2), 4134, 4135, 4136, 4138 (2), 4139, 4140, 4141, 4142, 4147, 4151, 4158, 4164, 4165, 4186, 4187, 4189, 4190, 4191, 4191, 4196, 4197, 4199, 4200, 4201, 4202, 4205, 4206, 4208, 4210, 4219, 4220, 4221, 4222, 4223, 4226, 4227 (2), 4259, 4263, 4265, 4266, 4267, 4270 4271, 4334, 4335, 4341, 4346, 4347, 4349, 4350, 4351, 4358, 4359, 4372, 4373, 4374, 4375, 4376, 4377, 4387, 4389, 4390, 4393, 4395, 4396,4397, 4406,4407, 4408, 4415, 4416, 4421, 4424, 4433, 4434, 4435, 4436, 4437, 4445, 4450, 4471, 4473, 4474, 4472, 4473, 4475, 4476, 4477, 4484, 4492, 4493, 4494, 4495, 4496, 4502, 4503, 4504, 4512, 4520, 4525, 4526, 4529, 4530, 4545, 4547,4552, 4558, 4565, 4570, 4583, 4584, 4587, 4590, 4591, 4603, 4623, 4624, 4625, 4626, 4627, 4628, 4653, 4666, 4667, 4672, 4702, 4703, 4704, 4705, 4711 (2), 4721, 4726, 4741, 4742, 4749, 4764, 4782, 4786, 4789, 4790, 4800, 4803, 4804, 4805, 4806, 4807, 4815, 4816, 4821, 4824, 4845, 4846, 4847, 4854, 4855, 4856, 4857, 4860, 4869, 4870 (2), 4880, 4892, 4907, 4916, 4921, 4945, 4952,4957, 4962, 5035, 5036, 5037, 5038, 5039, 5040, 5052, 5053, 5054, 5055, 5056, 5057, 5059, 5060, 5061, 5064, 5091, 5092, 5100, 5105, 5130, 5131, 5201, B1, B2, B3
References
Blanks, R. 2005a. Current Recognized Varieties of the Sea Coast Coil. The United States Specialist May 2005: 223-28.
Blanks, R. 2005b. A Sea Coast Die Cut Variety Surfaces. The United States Specialist Sept 2005: 423-25.
Blanks, R. 2005c. New “Rounded Shoulder” Bring Atlas Statue Coil Die Cut Types to Four. The United States Specialist Oct 2005: 466-68.
Blanks, R. 2010. Third Generation ATM Die Cutting Arrives. The United States Specialist Oct 2010: 445-50.
Linder, L., and Dromberg, D. A. 1983. The Serpentine Rouletted Stamps of Finland Issues of 1860 and 1866. Translation from The Handbook of Finnish Stamps. The Scandinavian Philatelic Foundation, Thousand Oaks, CA.
Linn’s Yearly Stamp Yearbook, 1995-2016. Amos Media Publishing, Sidney, OH.
Mustacich, R. 2014. Freak or Fake? A New Fingerprinting Method for Distinguishing between Original and Fraudulent Extra Perforation of 19th Century Revenue Stamps. The American Revenuer 67 (1): 2-19.
Mustacich, Robert V. 2016. Measurements of Stamp Separation Features by Digital Image Analysis. Proceedings of the Second International Symposium on Analytical Methods in Philately, Itasca, IL, November 2015, John H. Barwis and Thomas Lera, eds., Wilcox Printing and Publishing, Inc., Madrid, IA, pp. 73-85.
Nazar, R. 2013. Die Cut Production Varieties of the 32c Flag over Porch Self-Adhesive Stamp Produced by the BEP in Coils of 100. The United States Specialist Nov 2013: 510-24.
Nazar, R. 2019. Die Cut Types, Incision Styles, and Shoulder Cuts. http://www.usastamps.com/references/PNC_Catalog/Numbering_System/Extended.htm#Die_Cuts .Nazar Publication, NJ.
Scott, 2017. Scott Specialized Catalogue of United States Stamps & Covers, 2016. Amos Media Publishing, Sidney, OH.
Snee, C. 2017. Counterfeit United States 2014 Flag and Fireworks Coil Stamps Have Surfaced. Linn’s Stamp News, Feb 27, 2017. Amos Media Publishing, Sidney, OH. https://www.linns.com/news/us-stamps-postal-history/2017/february/counterfeit-united-states-flag-and-fireworks-coil-stamps.html
Smithsonian, 2019. Smithsonian National Postal Museum website. Regular Definitive Issues, Flora & Fauna Issues, 33-cent Blackberries. https://arago.si.edu/category_2040820.html.
Wista, 2019. So far self-adhesive stamps have only been cut (kiss-cut, die-cut). Wista GmbH,Schwaigern, Germany. https://wista.com/eng/postagestamps.php?type=selfadhesive