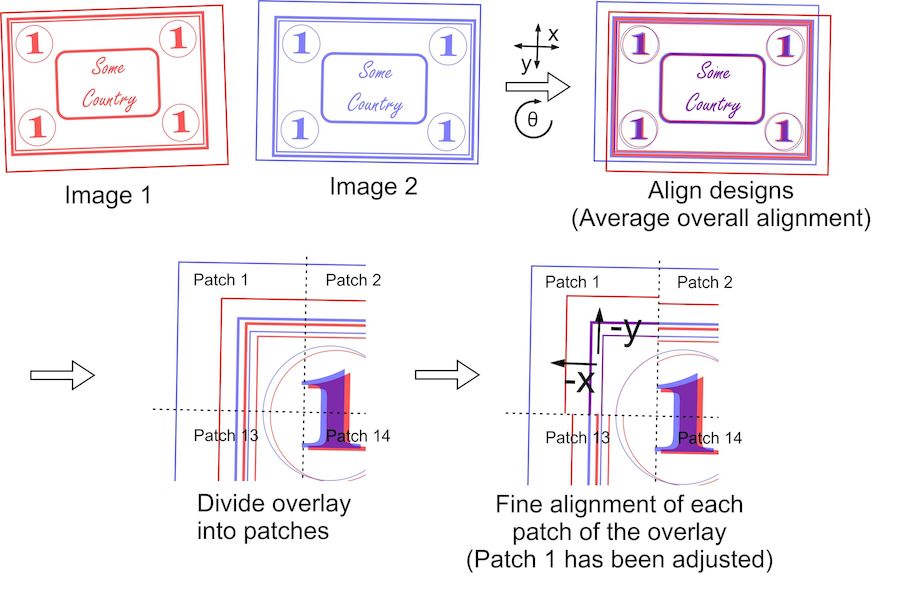
Figure 1. An illustration of the subtraction of two stamp images. The colored areas are the two printed designs that need to be aligned. After locating each of the designs within the two images, computer optimization aligns the designs using rotation, a horizontal shift, and a vertical shift. To compensate for small size differences and spatial distortions, computer optimization next re-aligns the image divided into small patches, one patch at a time. The fine adjustment of these patches provides an array of small, “second-order” corrections that are spatially blended to create a final image subtraction having fine alignment of image features throughout.
Because stamps are not perfectly rectangular and differ slightly in their overall sizes, the pixel-by-pixel subtraction with optimized alignment still exhibits a large amount of local misalignment spread over the extent of the image, a very unsatisfactory and relatively useless result. Additional steps to the image differencing process, shown in the lower part of Figure 1, compensate for this residual variation. In these steps, the overlay of the two aligned images is divided into an array of rectangular patches and their alignments are re-optimized just over the extent of each patch. An 8 x 12 array of patches was used in these studies for second order corrections. This was found to provide a robust balance between adequate contour detail and sufficient patch size to prevent erroneous patch alignments in regions with less design detail. A two-parameter optimization is applied to fine adjust the horizontal and vertical alignment of each patch. The result is an array of “second order” adjustments to finely align each patch. Minimizing the difference of the pixel-by-pixel subtraction is used again as the optimization criterion. The final illustration in Figure 1 shows the realignment of the corner patches so that the printed designs are now in proper alignment. The mathematics and other details of the overall process are described in the earlier published work (Mustacich, 2016).
The final step of the image subtraction uses an interpolation of these local adjustments to provide a satisfactory, high resolution subtraction of the stamp images. This process is demonstrated with images of a stamp with and without re-entry features (additional plate impression details typically made in error) in fig 1 of the earlier published work (Mustacich, 2016). Figs 2-4 of this earlier publication show similar applications to stamps having re-entries and plate flaws, and forgeries.
As mentioned in the introduction, the surprise of relating the second-order corrections to the actual plate impressions was discovered by comparing images within blocks of stamps, what I will refer to as “Intra-sheet” comparisons. It was possible to use linear combinations of these Intra-sheet subtractions to estimate the differences between the plate impressions. These differences reveal the relative distortion patterns between each of the plate impressions. It was further possible to generalize this process to arbitrarily large sizes of stamp multiples (Mustacich, 2016). The array of patch adjustments can be most easily viewed as a pair of contour maps, one for the horizontal corrections and one for the vertical corrections. For example, in the case of the vertical corrections, this array can be viewed as a topographic map in which the grid of altitudes has been replaced by the array of upward or downward shifts to the image patches.
Figure 2 shows the relative distortion patterns for the Intra-sheet differencing of the dry-printed 1953 U.S. ½ cent Franklin stamp, when comparing two different sheets from plate number 26003 for the same block of 16 stamps. In these contour plots, dark shades represent upward image adjustments and light shades are downward adjustments. Notice the similarity of the patterns when comparing the same plate positions for the two different sheets. For example, the top rows of both exhibit a relative compression of the height of the image (top shifted downward and bottom shifted upward). The magnitude of these shifts in Figure 2 is small, typically less than 10µm. Thus, each plate position has its own distortion pattern, a consequence of the small differences in the “plastic” flow of the soft steel of the plates when manually rocking in each impression from the transfer roll. Extremely high pressures are required with as many as 20 or more passes when rocking in a design. The pressures when making the transfer roll itself have been reported to be in the range of 8-35 tons per square inch (110-483 MPa) (Sheaff, 1981). Consequently, variation is inevitable. This small variation inherent in the plate differences should be present in comparing any two stamps of the same issue. The research described in this article seeks to overcome the limitations of Intra-sheet comparisons, namely the requirement for large stamp multiples, because of their potential scarcity and cost, and the inability to analyze individual stamps. The desired goal is to subtract any two single stamps of the same issue, regardless of plate number and plate position, and arrive at a distortion pattern revealing differences in their plate impressions.
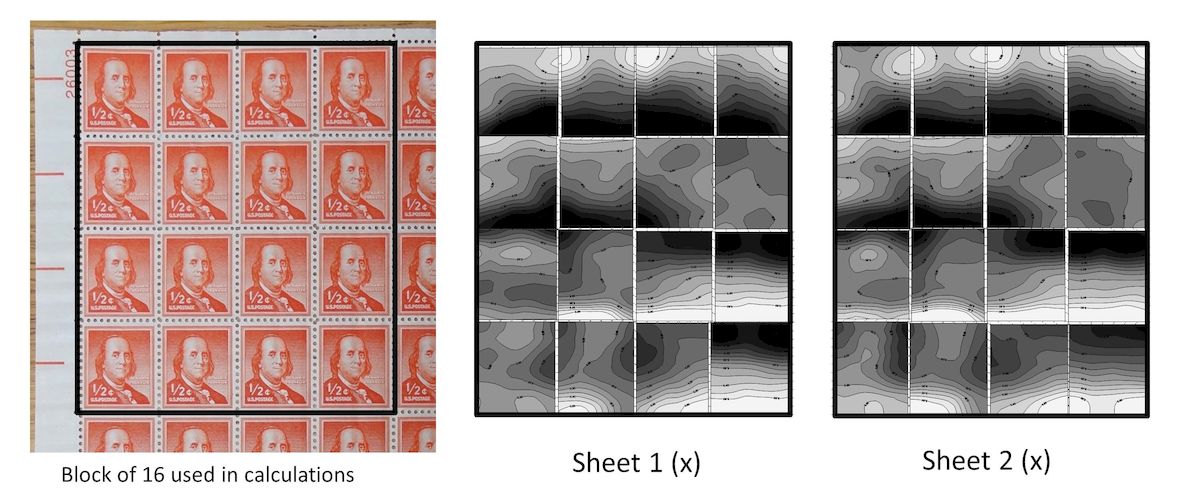
Figure 2. A comparison of distortion patterns between plate impressions calculated for two blocks of 16 stamps, same plate number 26003, same plate positions, of the 1953 dry-printed ½ cent U.S. Franklin stamp using the Intra-sheet method published earlier (Mustacich, 2016). These contour plots, like topographic maps, show the vertical shifts of the die features, darker shades being increasingly upward, and lighter shades being increasingly downward. Note the similarity of the distortion patterns in comparing the same plate positions in the two blocks.
Modifications to the Previous Method
When the method in Figure 1 is applied to a pair of stamps having different sizes, gradients are introduced to the distortion patterns. This problem is demonstrated in Figure 3. I directly subtracted the stamps in the ten blocks of same plate number 25981 of the 1953, dry-printed, ½ cent Franklin stamp used in fig. 8 of my earlier publication with a single reference stamp. The tenth block in the earlier study, which lacked gum, was replaced with an additional mint, never-hinged block for this research. I grouped the distortion patterns in the lower part of the figure for each of the four plate positions, a-d, for direct comparison. To obtain distortion patterns with some overall balance in appearance, I selected a reference stamp of this issue that was nearest the average width and height of the stamps. (For balanced viewing of a set of distortion patterns, the average value of the patterns can also be subtracted from the patterns. This adjustment would itself be an array of the average corrections at each patch position that would represent a shift to a hypothetical reference stamp of average properties.) Figure 3 reveals large gradients and wide variation in the patterns, unlike the consistency shown in Figure 2, or in the Intra-Sheet results for the same blocks in fig. 8 of the previous, referenced study.
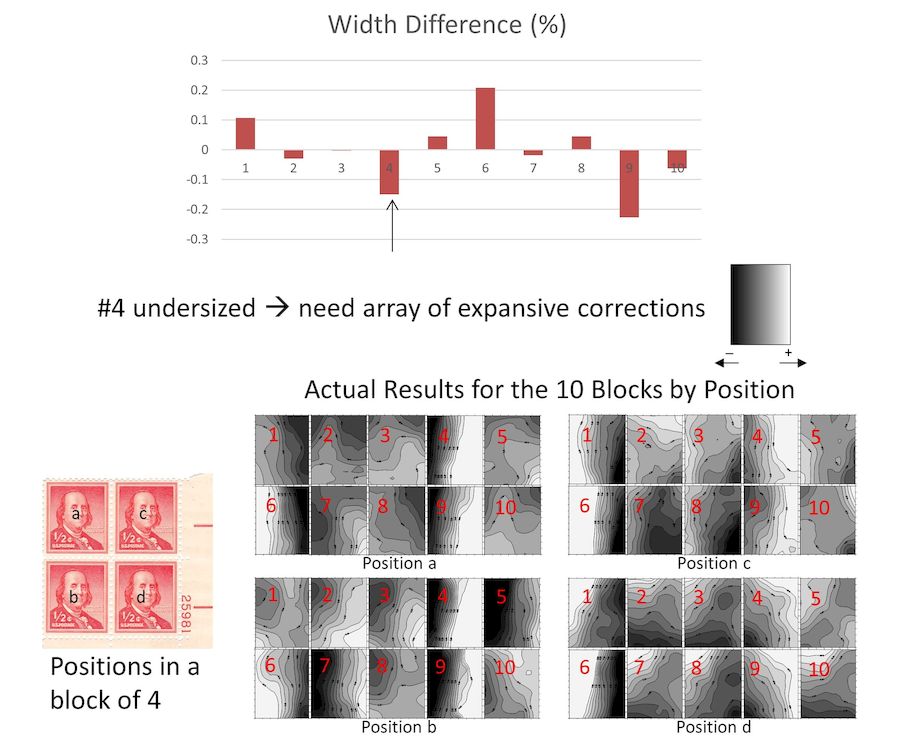
Figure 3. A comparison of image differencing results, grouped for each of the four positions, for ten, same plate number blocks (lower right #25981) of the 1953 dry-printed ½ cent U.S. Franklin stamp, along with a bar chart showing width differences compared to the average width. A single reference stamp of near average size was used for these comparisons. The plate blocks are numbered from 1 to 10, with the positions a-d separately grouped for comparison. The bar chart shows that the average widths of blocks #4 and #9 are significantly undersized relative to the reference stamp. Because block #4 is undersized, for example, an array of expansive second-order corrections is needed to match the reference stamp. The expansion would require contours with the gradient illustrated at center right. The stamps in blocks #4 and #9 exhibit the presence of this gradient in their contour patterns. Stamps in the oversized block #6 exhibits the opposite gradient. The general inconsistency at each position is largely explained by size differences of the stamps.
The upper portion of Figure 3 contains a bar chart of the width differences of the stamps compared to the average width. I calculated the sizes of each stamp in the blocks using the four virtual corners (a routine in the computer analysis illustrated in Figure 1). The size differences compared to the average of all the stamps are similar within each block, and I represented the average result for each block as a bar in the chart. While these size differences may seem very small, a 0.2% difference in a stamp image having a 1,000 pixel dimension, a typical stamp size at 1200 dots per inch resolution, amounts to a 2 pixel misalignment. This is a large systematic error when subtracting pixel by pixel. For example, the stamps in block #4 have a smaller width than average. The adjustments to the images of the stamps in this block to match the width in the reference stamp image would require horizontal stretching. This corresponds to the left side moving further left, thus negative changes (dark shades) in the x coordinate, and the opposite changes to the right side. The expected gradient from these expansive corrections can be visualized by the contour plot shown at center right in Figure 3. Blocks #4 and #9 are significantly undersized, and the distortion patterns for all four stamps in these blocks reveal this dominant gradient. The oversized block #6 has the opposite gradient.
Real variations in the movement of the soft steel when creating plate impressions should result in small size differences. However, the post-printing shrinkage of the paper is large and quite variable depending on the degree of wetting and the properties of the paper. Large distortions, such as the examples in Figure 3, are much greater than those found in Intra-sheet comparisons, and directly correlate with large size differences. This suggests that factoring size differences into an image subtraction could correct for this artifact. A direct way to incorporate this would be to resize one of the images by a proportionality factor based on the measured size difference before the first alignment step in Figure 1. I created such a “Linear Scaling” method by using ratios of the average widths and heights of the two stamps to resize one of the images. Since the stamps are not perfectly square, I used the average distance between lines fit to the stamp edges to determine widths and heights. An expected shortcoming is that this approach may overcompensate and eliminate small size differences that exist in the plate impressions. However, departures from rectangularity will remain since this irregularity is not corrected by a simple proportionality factor. The Linear Scaling method also will not correct for shrinkage which is not uniform over a stamp, but nonuniform wetting is not expected to be a large problem; the paper used for stamps is porous and water is highly mobile through capillary action. This assumes some reasonable consistency in the wetting of stamps for printing, which may not be the case for early stamp production.
Another approach to size compensation is the use of bilinear mapping. As mentioned above, stamps are not perfectly rectangular, and are more accurately classified as “irregular quadrilaterals,” which are four-sided polygons with unequal sides. A bilinear mapping connects each point in one quadrilateral to a corresponding point in another quadrilateral. Figure 4 shows a bilinear mapping between two stamps, their irregularity exaggerated for illustration purposes. Each quadrilateral is gridded with lines which divide the sides by the same proportions; in this example, each vertical side is divided by the grid lines into five equal lengths. In this manner, every point in a quadrilateral corresponds uniquely to a point in another quadrilateral having the same proportions in its grid. The red arrow in Figure 4 illustrates how each point in one grid maps to a corresponding point in the other grid determined by intersecting lines with the same proportions along each side. While a bilinear mapping should overcompensate for shape irregularity originating from the plate impression differences, nonlinear distortions in the plate impressions will remain. To implement bilinear size adjustment, I simply modified the image subtraction process shown in Figure 1 by substituting a bilinear mapping for the initial, overall alignment step (finding shifts and a rotation as illustrated in the top right). The remainder of the process is the same. I have termed this approach simply “Bilinear.”
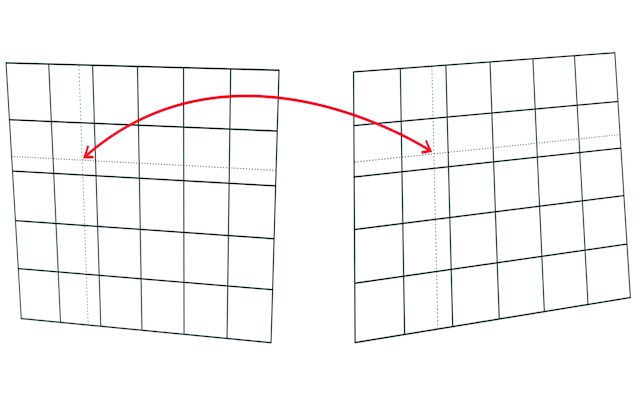
Figure 4. Bilinear mapping between two stamp images, their irregular shapes exaggerated for illustration purposes. The grid lines in each image divide the edges by the same proportions. The red arrow illustrates the corresponding points in the two images having grid lines of the same proportions, shown as dashed lines. This approach is one of the alternatives for matching in-plane distortions such as shrinkage.
The eight corner positions for the two stamps fully define the mapping. Consequently, the quality of bilinear mapping depends on the accuracy of the corner positions. An interesting possible improvement to this mapping is to more accurately align the four corners of the two stamps as an initial step. This can be done with the image matching illustrated in the second stage of Figure 1, applied to the corner patches. I have termed this method “Bilinear-4C,” an abbreviation of “Bilinear-Four Corners.” This conceptually offers a more accurate approach than the Bilinear method. I have also tested the same matching of the four corners of the stamps as a variation with the Linear Scaling approach. For this variation, I calculated scaling factors from the corner adjustments before proceeding with the overall image alignment step in the top right of Figure 1. I termed this variant of the process “Linear Scaling-4C.” It is not clear whether this should provide any advantages compared to the Linear Scaling approach which instead uses the lines fit to the side edges to calculate a scaling factor.
Perspective mapping is yet another approach which maps quadrilateral shapes to one another. The goal of three-dimensional perspective with irregular quadrilaterals typically is to create the appearance of the shorter sides of the quadrilateral receding from the observer. This relative compression of some image content to simulate distance results in very large distortions in the second order corrections, an unwanted artifact in comparing relative distortions between stamps. Certain image “warping” tools in popular software were tested and found to introduce large distortions of this type. Since stamp printing and paper shrinkage are processes occurring in the plane of the paper, methods or image manipulation tools involving perspective mapping were not considered further for adjusting stamp sizes.
Results
I tested these modified methods with large blocks of stamps, same plate number and plate positions, to compare the consistency and performance with results using the Intra-sheet method published earlier (Mustacich, 2016). I developed a statistical comparison since the specific results obtained with each method can vary slightly by plate position; small variations by plate position make it difficult to visually assess the relative overall performance of similarly performing methods. I used a direct measure of the difference between a pair of distortion patterns, both calculated relative to the same reference stamp. I expressed this measure as the sum of the absolute values of the differences between the two arrays of second order corrections
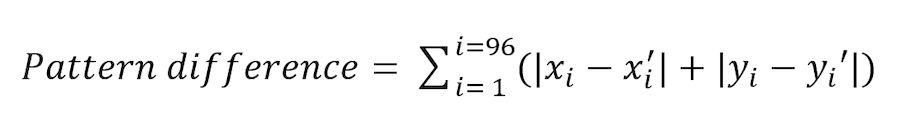
where(x_i,y_i) are the second order corrections for the first stamp for patch i; (x_i',y_i') are the corrections for the second stamp for patch i; and the differences are summed over the 96 patches used in this study for computing second order corrections. The use of absolute values maximizes the measurement of the pattern difference by preventing accidental cancelations in the summation of the differences. Good matching of the distortion patterns results in small pattern difference values.
The desired objective with the modified subtraction methods is to achieve smaller pattern differences for matching plate positions, in other words a relative consistency of results in comparing same plate position stamps printed from the same plates. Thus, a comparison of the distribution of the pattern differences between the same plate positions with the distribution of pattern differences between nonmatching plate positions can be used to evaluate the performance of an image subtraction method applied to two sheets having the same plate number. I illustrate the idealized comparison of these two distributions in Figure 5. The solid line shows a distribution of pattern differences between same plate positions, compared with the dashed-line distribution representing the differences between nonmatching plate positions. Because there are many more combinations of nonmatching plate positions, the area under this distribution is much larger.
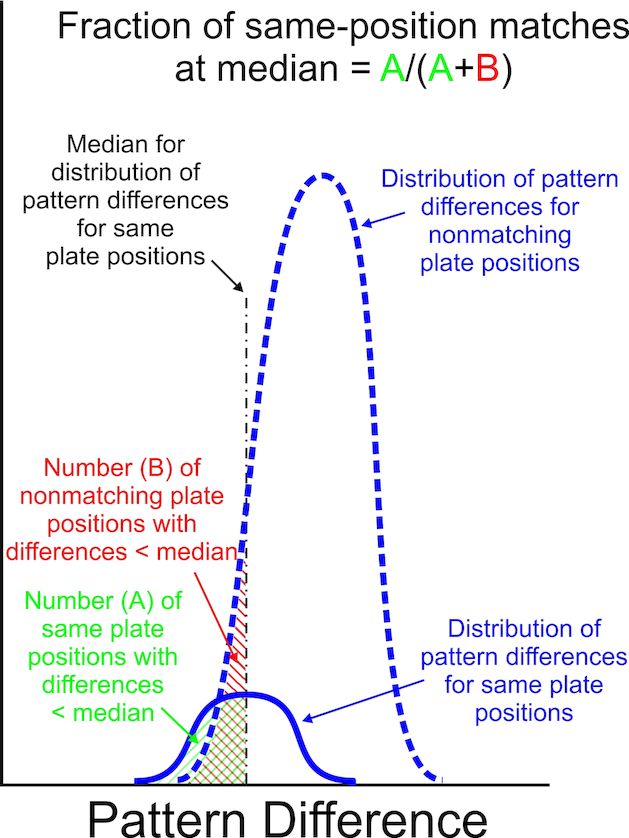
Figure 5. An idealized comparison of two distributions, one for pattern differences between same plate position stamps (solid line), and one for pattern differences between stamps from nonmatching plate positions (dashed line). Ideally, a method to extract distortion patterns that is selective for same plate positions should have the solid-line distribution to the left and minimize overlap with the dashed-line distribution. The areas under both distributions up to the median of the solid-line distribution can be used as a qualitative measure of the overlap. Larger ratios of area A to the total areas (A+B) indicate better discrimination of same plate positions.
For comparing the relative merit of a method, I use the median from the distribution of pattern differences for the same plate positions to determine the number of results in the larger distribution for non-matching plate positions which achieve equal or smaller pattern differences. I illustrate this in Figure 5 as the comparison of the green hatched area with the red hatched area, each containing a total of A and B, respectively. The red hatched area B is the number of nonmatching patterns that are coincidentally similar. These represent “false positives” in the sense of using the median value for the matching position results to discriminate for matching plate positions. The fraction of all possible combinations that represent matching positions at this median value can be then expressed as a percentage using the ratio A/(A+B). Methods with greater values of this percentage provide better discrimination of plate position matching. Methods with the largest A/(A+B) ratios should be considered the best performing methods, provided that the underlying distributions are not unusually broad, a condition suggestive of poor general performance.
Figure 6 shows the distributions of pattern differences for the various methods applied to the U.S. ½ cent Franklin stamp of 1953, dry-printed, plate #26003, for 28 positions on two separate sheets (a total of 56 stamps). For a reference stamp, I selected a stamp closest to the average size. This reference stamp was not used in the intra-sheet method since the stamps of each sheet collectively serve as references in this specific method. Figure 6 includes a table of results showing in order the following: the median of the distribution for same position differences; the range of the pattern differences for matching positions from the tenth percentile to the ninetieth percentile; the percentage of pattern differences for matching plate positions up to the median; and the median for the distribution of nonmatching pattern differences. Note the different scales on the vertical axes for each pair of distributions. The dashed distributions for nonmatching plate positions include more combinations, and these distributions use the vertical scales shown on the right.
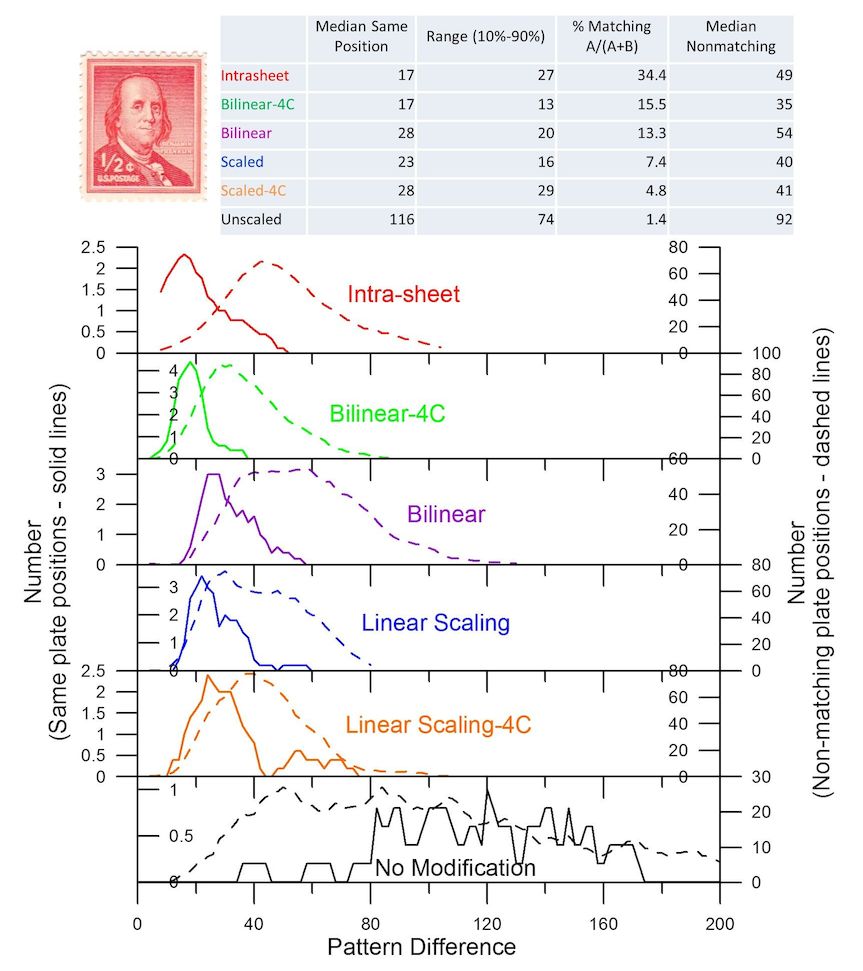
Figure 6. A comparison of distributions of pattern differences, for same positions and for nonmatching positions, for the modified methods of image subtraction together with the earlier published Intra-sheet method for reference. All but the Intra-sheet method compare stamps of the dry-printed ½ cent 1953 Franklin stamp, plate number 26003, with a single reference stamp. The Intra-sheet method is the previously published method using a large block of stamps from the same sheet. The table provides several measures of the distributions that are described in the text. The Bilinear-4C method performs best of the modified methods.
The top and bottom examples in Figure 6 show the two extremes in this example, but actually use the same image subtraction method shown in Figure 1. The difference is that the Intra-sheet method uses multiple stamps from the same sheet as references and then combines these to determine the distortion patterns as described in my earlier publication (Mustacich, 2016). The same approach, instead using a single reference stamp, gives relatively poor performance as evidenced by the bottom distribution “No Modification.” This is essentially another view of the poor performance of the original method used with a single reference stamp in Figure 3. The best result of the modified methods is the Bilinear-4C method. This method gives both a narrow distribution and small pattern differences similar to the results obtained with the Intra-sheet method. However, there is more overlap with the nonmatching pattern difference distribution which reduces the percentage score in the table by more than 50% compared to the Intra-sheet method. The Bilinear method does nearly as well, while the linear scaled approaches do not perform as well.
Figure 7 displays the distortion pattern contours comparing same plate position blocks of 16 from the two sheets using the top four scoring methods. I show comparisons for two blocks of 16 stamps from the upper left plate number 26003 blocks, a subset of the stamps used to compute the distributions in Figure 6. These contours are the vertical component of the second order corrections, although the pattern difference values in Figure 6 include both the horizontal and vertical component differences. Comparing the same positions in the blocks from the two sheets shows good similarity between the Bilinear-4C method results, but not as strong a result as obtained with the Intra-sheet method. The contours still generally show similarities with the Bilinear and the Linear Scaled approaches, but these are not as consistent as the first two approaches shown. Similar observations apply to the comparison of the horizontal component contours.
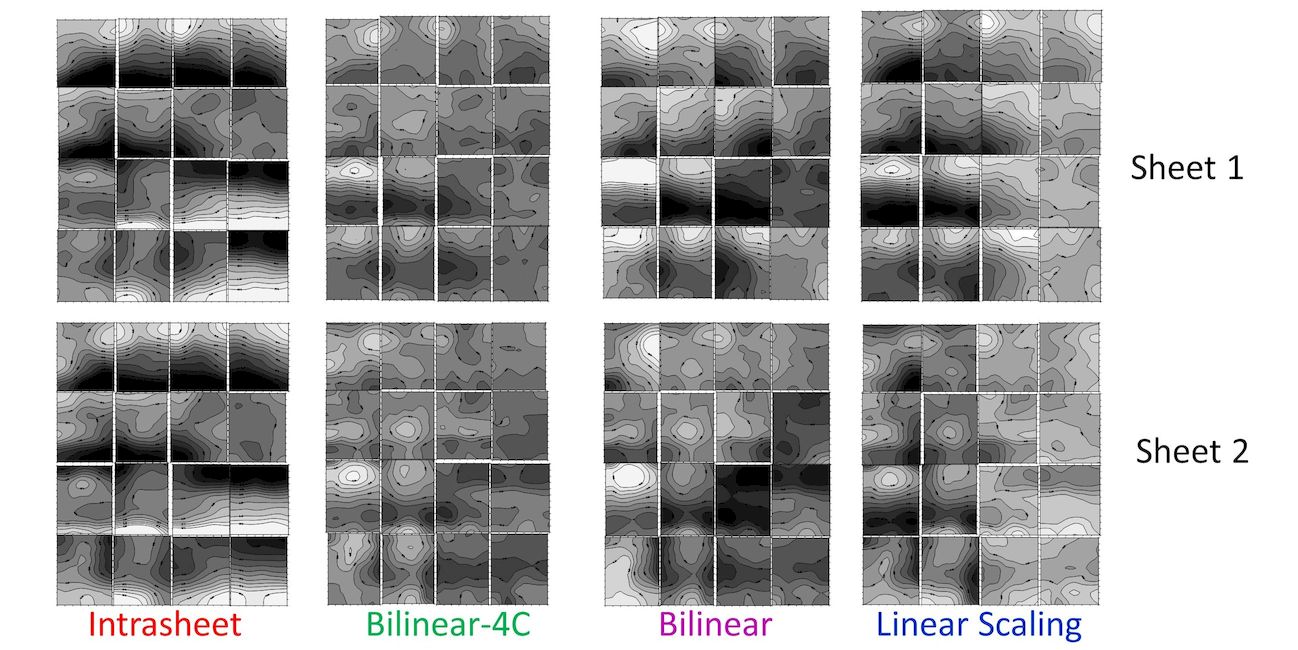
Figure 7. Contour plots for the vertical component of the distortion patterns comparing the same plate position block of 16 stamps from two different sheets for the four, best-performing methods in Figure 6. In comparing the contours for the same sheet positions, the similarities are still reasonably strong for both bilinear methods compared to the Intra-sheet method.
Interestingly, the order of performance is changed with the U.S. ½ cent Franklin stamp of 1953, wet-printed, plate #25263. During printing, these stamps have an estimated 2-3x greater water content than dry-printed stamps, and are subject to greater shrinkage (Faries, 1982). Figure 8 shows that the Bilinear-4C method now provides the best performance, and the Intra-sheet method is third best. Again, a comparison between sheets of the vertical component contour patterns for plate number blocks of 16 from the lower left plate number position of plate #25263 is shown in Figure 9 for the four best performing methods. Similarities generally hold up well in comparing the results of these methods applied to the separate blocks. Figure 10 shows the results using plate number singles, strips and small blocks for the 1898 U.S. Proprietary 1/8 cent revenue stamp, plate number 7972. This set of 61 stamps used for testing included 34 same-plate positions. There is larger variation in these stamps reflected by the overall greater pattern difference values compared to the distributions in Figures 6 and 8 (the Figure 10 distributions are shifted to the right). Some of the distribution widths are also much wider. Both of the bilinear methods continue to perform best, with the Bilinear-4C method performing slightly better. This method also provides the narrowest distributions. These late 19th century revenue stamps may be more representative of the challenges presented by early stamp production with presumably less quality control.
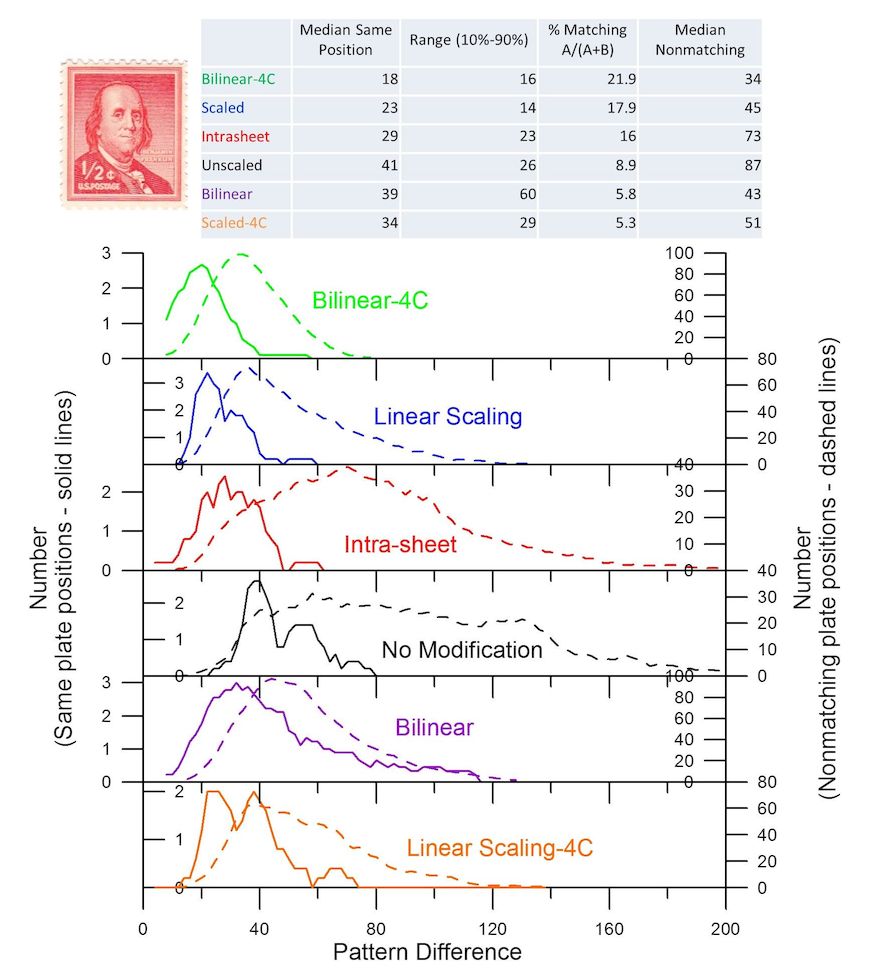
Figure 8. Another comparison of distributions of pattern differences (as illustrated in Figure 5), same positions and nonmatching positions, for the modified methods, but with the wet-printed ½ cent 1953 Franklin stamp, plate number 25263. The Bilinear-4C method performs best, with the Intra-sheet method now third-best.
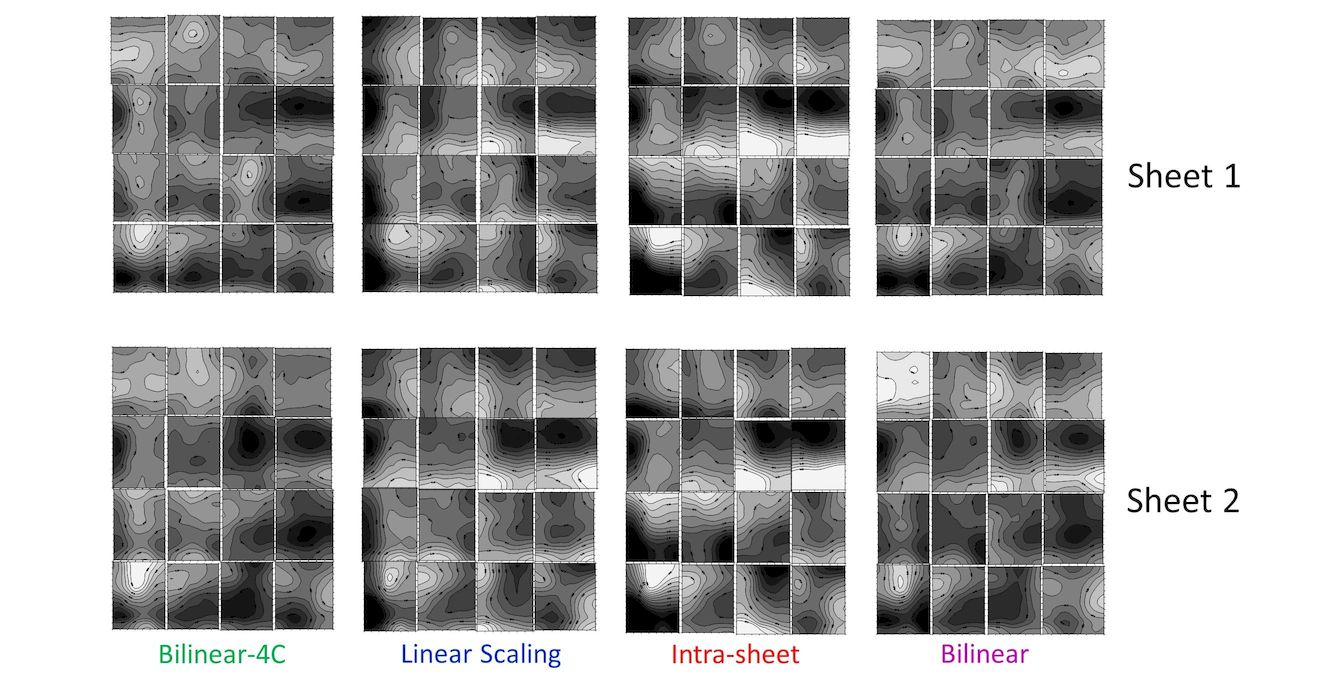
Figure 9. Figure 9. Contour plots for the vertical component of the distortion patterns comparing the same plate position block of 16 stamps from two different sheets for the four, best-performing methods in Figure 8. The Bilinear-4C, Scaled, and Intra-sheet methods provide good consistency between the contour results for the two sheets.
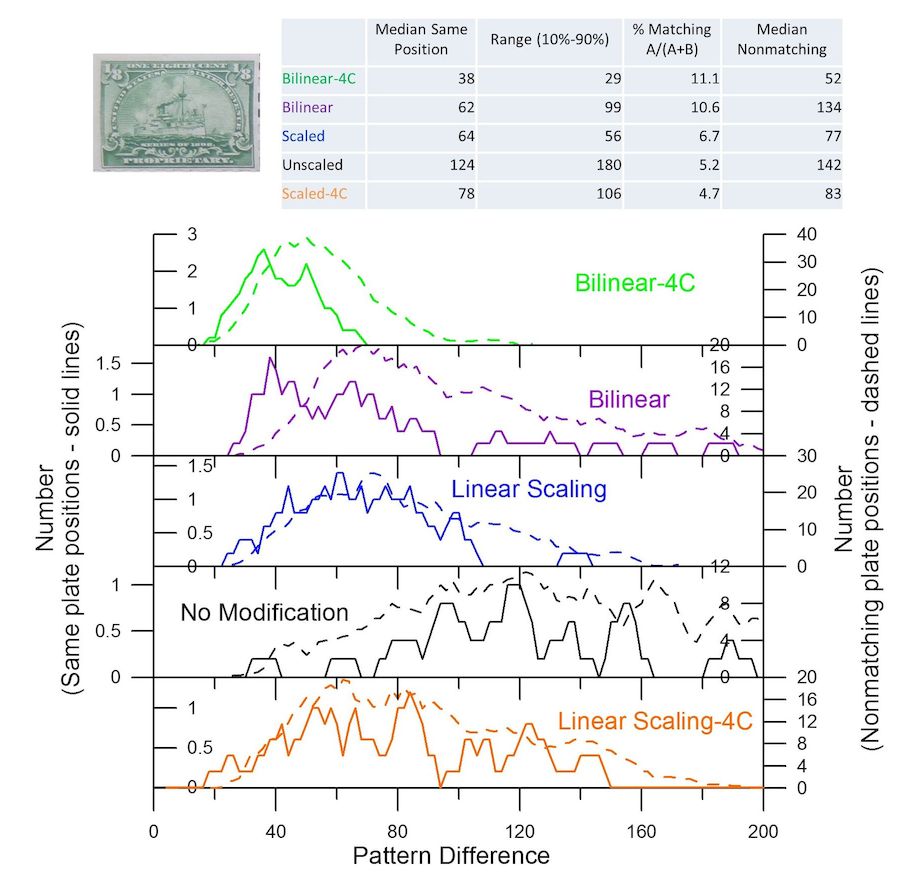
Figure 10. A comparison of distributions of pattern differences, same positions and nonmatching positions, for the modified methods, but with the singles and small multiples of the 1/8 cent U.S. Proprietary Revenue stamp of 1898, plate number 7972. It was not possible to test the Intra-sheet method because of the lack of any large multiples. The bilinear methods performed significantly better, but with broader, more variable distributions of pattern differences.
Early printing plates can have numerous re-entries of the impressions from the transfer roller, a result of contact with the transfer roller. This may be especially true of early U.S. revenue stamp plates in cases when the plates were hurriedly produced. Applying too much pressure too fast when rocking in a design can cause “shift transfers” which can appear as a thickening of lines or other design elements, or as a distinct doubling (or tripling if additional shifts occurred) (Sheaff, 1981). Misaligned re-entry after removal of the transfer roll to inspect progress can result in “double transfers.” Re-entry features can also result from something going awry in the equipment, and mishaps such as “accidental transfers” and “foreign transfers.” Many of these, especially shift transfers, are minor in their detail and consequently both challenging and tiring to compare visually. Many of these differ in detail too faint to easily examine just the image subtraction results. Examination of the direct subtraction works well with strong re-entries, such as certain re-entries in the U.S. 1898 Proprietary issues (Mustacich, 2016). As an application to very faint re-entries, I used the Bilinear-4C method to compare a large group of these stamps with a reference stamp, and then had the computer determine the pattern differences for all possible combinations of these stamps.
A large set of re-entries for the 1898 U.S. Proprietary 1-7/8 cent revenue stamp was assembled by Anthony Giacomelli, a specialist of minor re-entries in these issues (Giacomelli, 1981, Bosch, 1983). He grouped these stamps according to similar re-entries based on visual study with a magnifying lens, and the entire set was numbered with members of the same group adjacent to each other in the numbering. The differences can be small and confusing, and Mr. Giacomelli considered only some of these to have strong similarities. Stamps with perforations into the design or other serious flaws preventing image differencing were removed by me. A set of 24 stamps with minor re-entries remained for analysis, identified by numbers ranging from 23 to 50. I selected a stamp of average size as a reference stamp. A matrix containing all possible pattern differences is shown in Figure 11. Smaller pattern differences are highlighted in darker shades of green. Each position in this matrix shows the pattern difference value calculated for the stamps of that row and column. Reversing the order of the two stamps gives the same result, so the matrix is symmetric about the diagonal. Consequently, half of the matrix consists of duplicate results. Because every stamp matches itself, the diagonal consists of zero values. With an estimated same-position matching percentage of roughly 10% from the analysis of similar stamps in Figure 10, there should be many coincidental small values for the pattern differences arising from nonmatching plate positions. An examination of stamp pairings with small pattern differences in Figure 11 confirmed many of the stamp associations that Mr. Giacomelli had made, but also led to the re-examination of many stamps. After additional visual study of possible relationships suggested by Figure 11, or lack thereof, there were some new associations and rejections made. Stamps found to be similar in features and die distortion patterns were color-coded in Figure 11, and I show some of the detailed features of these stamps in Figures 12-14 along with their horizontal and vertical distortion patterns. The strongest re-entry features on these stamps lie along the left edge of the stamp, and the close-up photos correspond to the top left corner, lower left edge, and bottom left corner for each stamp. Doubled features are labeled with a red “D,” and tripled features with a red “T.” The colored boxes group similar re-entries based on these features and their pattern differences in Figure 11.
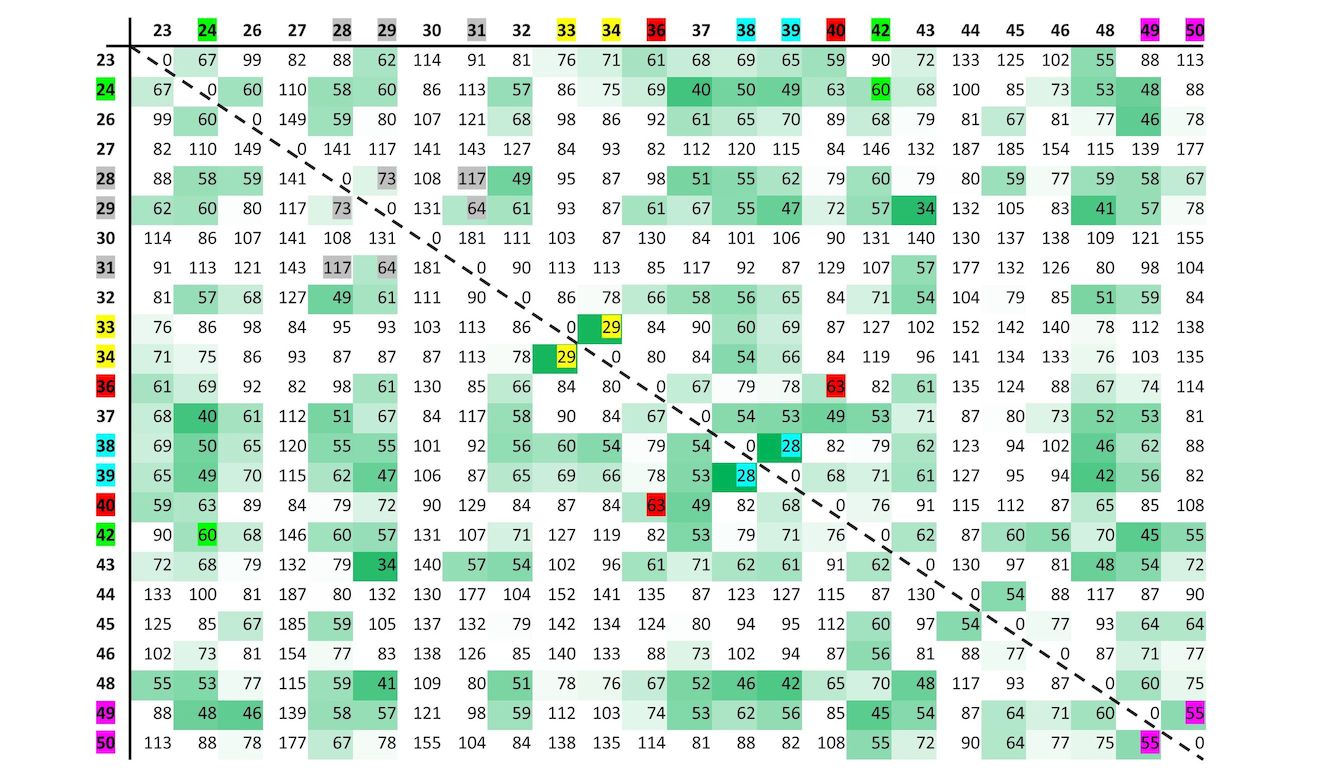
Figure 11. A matrix of the pattern differences comparing a large set of images of the 1-7/8 c. U.S. Proprietary Revenue stamp of 1898. This set of images consists of single stamps of unknown plate number and plate position. The images, numbered between 23 and 50, were separated from a larger set of images for the presence of minute re-entry features found on these stamps. Similar re-entry features were grouped for their similarities and adjacently numbered. Small pattern difference scores are highlighted in green to bring attention to possible matches based solely on their distortion pattern differences using the Bilinear-4C method. I re-examined and revised groupings using this additional information. Stamps found to have similar re-entry features by visual examination suggested by these groupings are color coded.
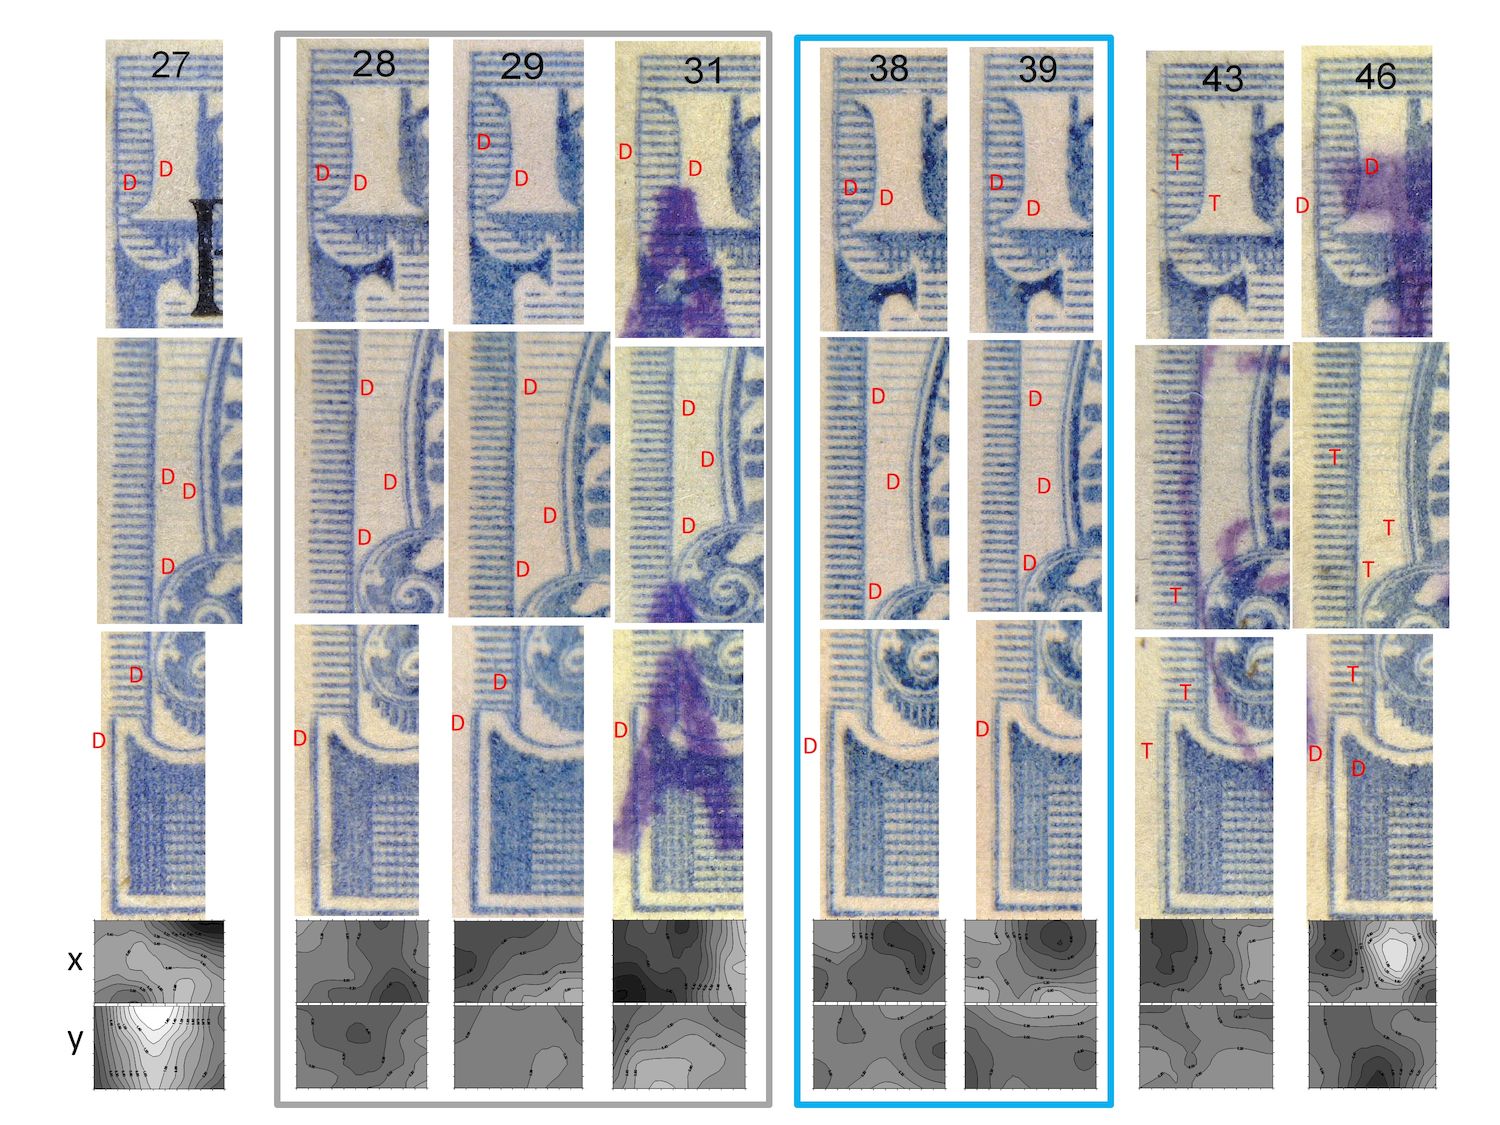
Figure 12. Close-up views of three regions along the left edges of the 1-7/8 c. U.S. Proprietary Revenue stamp of 1898 which contain the prominent re-entry features found on this issue. The images are labeled with the same numbering and color coding used in Figure 11, and the groups of similar re-entries determined from study of the distortion pattern and re-entry similarities are color coded. Both the horizontal and the vertical contours are shown below the magnified views. Small red “D” and “T” labels on the views highlight areas with doubling and tripling of features.
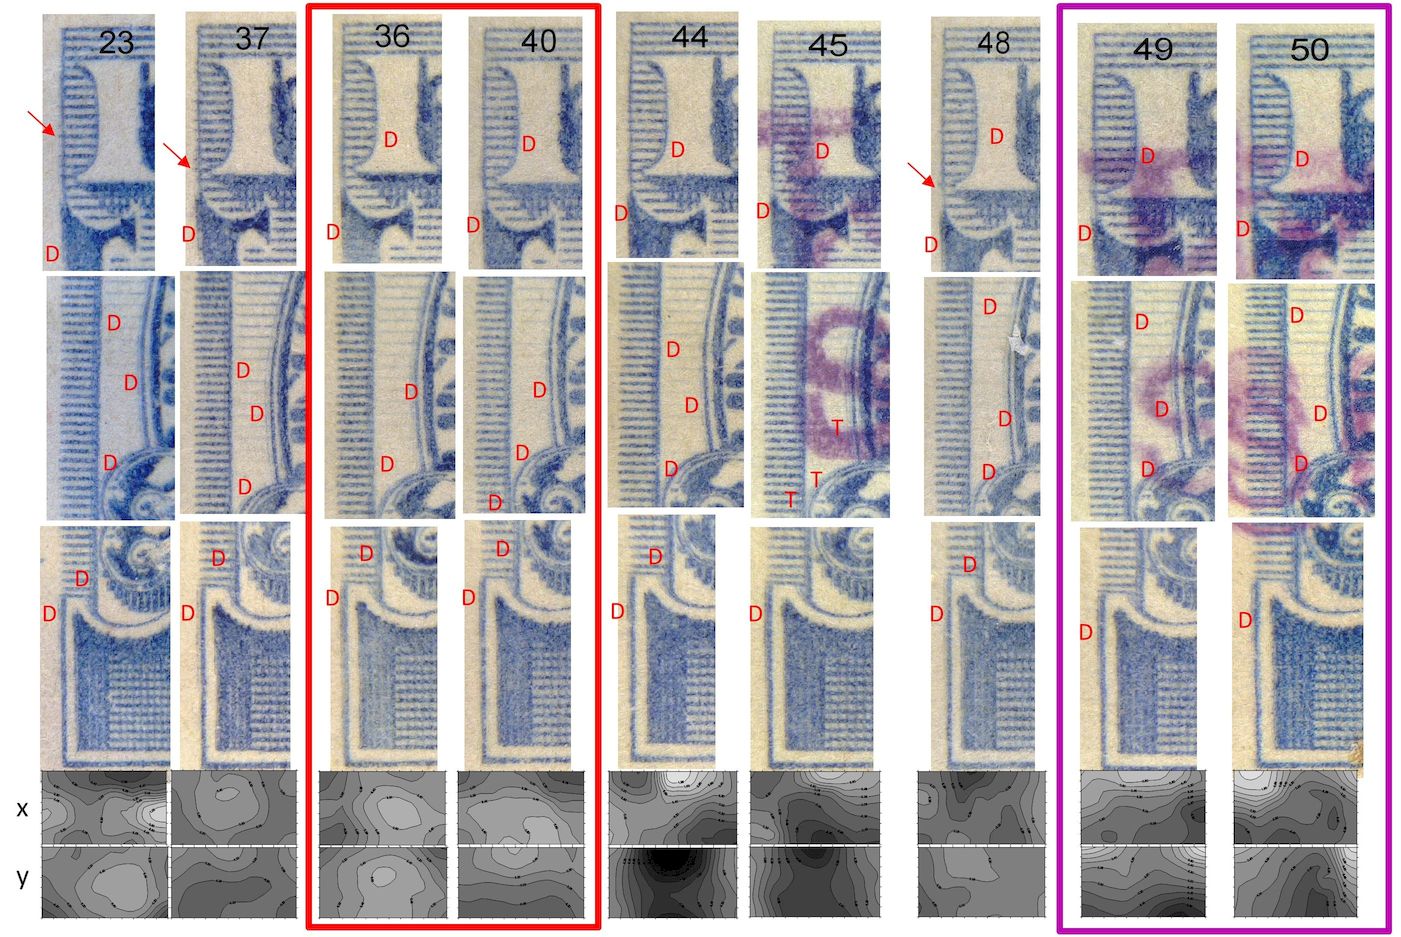
Figure 13. Close-up views of three regions along the left edges of the 1-7/8 c. U.S. Proprietary Revenue stamp of 1898 which contain the prominent re-entry features found on this issue. As in the previous figure, the images are labeled with the same numbering and color coding used in Figure 11, the re-entry features are similarly labeled, and the images are coupled with their respective horizontal and vertical contour patterns.
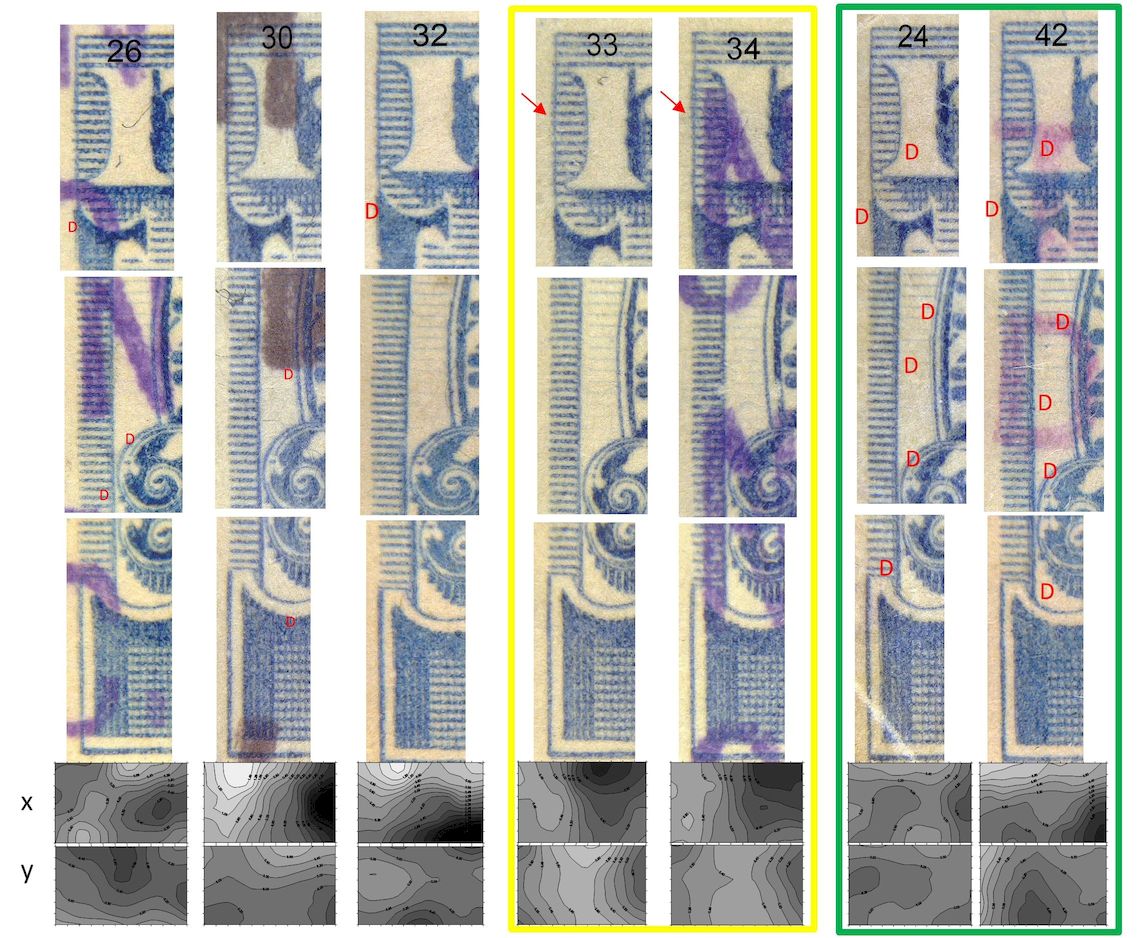
Figure 14. Close-up views of three regions along the left edges of the 1-7/8 c. U.S. Proprietary Revenue stamp of 1898 which contain the prominent re-entry features found on this issue. As in the previous two figures, the images are labeled with the same numbering and color coding used in Figure 11, the re-entry features are similarly labeled, and the images are coupled with their respective horizontal and vertical contour patterns.
The first group of minor re-entries highlighted with gray in Figure 12 have similar distinguishing features in the photographs. The distortion patterns are less matched in appearance for this group compared to the other groups, with stamp #29 having intermediate patterns with some similarities to #28 and #31. Perhaps these differences with #29 are within the range of variations that can occur, but spatially contrary with each other. The pattern differences in comparing #28 and #31 are much larger than the other groupings in this analysis. Both #27 and #30 (shown in Figure 14) were rejected from this group based on their features and pattern differences. The other blue-highlighted group in Figure 12 has a small pattern difference and similar distinguishing re-entry features. The red-highlighted group in Figure 13 share similar features to each other. The pattern differences for this group are small with #37 (to the left of this group in Figure 13), but #37 has stronger re-entry features at the top left edge indicated by the red arrow. The magenta-highlighted group at the far right in Figure 13 have similar contour patterns and re-entry features. While there are some shared features of this group with #48, the distortion patterns are very different and there are additional re-entry characteristics that can be found on #48. Stamps #44 and #45 in Figure 13 were originally considered to be similar. While their distortion patterns are also similar, there are faint triple features that appear peculiar to #45. I show two additional groupings highlighted in yellow and green in Figure 14. These groups appear to share the same re-entry characteristics and have small differences in their contour patterns. I excluded stamp #32 from the yellow-highlighted grouping based on further examination of its re-entry features and its greatly differing contour patterns. Stamps #24 and #42 were originally grouped with other stamps, but further examination of their re-entry features and their pattern difference value resulted in this new grouping.
The ability of the Bilinear-4C method to assist in the grouping of stamps based on similarities in their die distortion patterns suggest that this method could be implemented in studies to re-plate stamps where large multiples are scarce. Reducing the number of stamp groupings to the number of plate positions has been one of the challenges in efforts to re-plate early stamps using large quantities of single stamps (Castenholz, 1980).
Summary
This research demonstrates the successful extension of the earlier method of determining relative die distortion patterns from multiples of stamps to the comparative analysis of individual stamps. Modified methods were compared for their ability to compensate for size changes due to post-printing shrinkage, and the bilinear methods performed best. For pre-1953 wet-printed engraved stamps, superior results were achieved with single stamps compared to intra-sheet analyses using multiples. A bilinear method employing local image matching of the four corner regions to more precisely define the corner positions of the stamp design in the image gave the best performance.
While the previous intra-sheet analysis method requires large multiples for repeatable results between sheets, these new methods for directly comparing individual stamps’ relative distortion patterns require only a single reference stamp. This allows a wide set of stamps from the same issue to be compared as singles regardless of plate number and plate position. This was demonstrated in the analyses of groups of stamps thought to share faint re-entry features, but originating from unknown plates and positions. I used a comparison of the distortion patterns from a large group of stamps to challenge and reassess the original groupings of these stamps. While many of the original groupings were confirmed, a number of the results were revised and new relationships were discovered.
References
Bosch, W. L. 1983. Re-Entries on the 1898 Two Cent Battleship Documentary. The American Revenuer, 37: 82-87. Castenholz, B. J. 1980. Replating the Civil War Revenues. The American Revenuer, 34: 52-53. Faries, B. 1982. Stamp Printing: Wet, “Dry,” and No Water at All. S.P.A. Journal, 44: 707-708. Giacomelli, A. 1981. The Fabulous Battleship Stamps of 1898. The American Revenuer, 35: 138-157. Mustacich, R. V. 2016. “Digital Image Differencing of High Resolution Stamp Images.” In Proceedings of the Second International Symposium on Analytical Methods in Philately, Itasca, IL, November 2015, John H. Barwis and Thomas Lera, eds., pp. 57-72, Madrid, IA: Wilcox Printing and Publishing, Inc. Sheaff, D. 1981. Positions, Plate Varieties. The American Revenuer, 35: 38-39.