(This article is re-formatted from the following publication:
Mustacich, Robert V. 2016. Measurements of Stamp Separation Features by Digital Image Analysis.
Proceedings of the Second International Symposium on Analytical Methods in Philately,
Itasca, IL, November 2015, John H. Barwis and Thomas Lera, eds.,
Wilcox Printing and Publishing, Inc., Madrid, IA, pp. 73-85.)
Robert V. Mustacich, 722 Camino Cascada, Santa Barbara, CA, USA.
ABSTRACT. Digital image analysis of perforations provides useful characterizations of stamps and the mechanical processes used to create them. Using this approach, the hole sizes, the spacing between holes, and related parameters are easily measured to micron-level precision. The 150 year history of stamp perforation is revealed by analyzing entire sheets of stamps, showing stages of improvement in the quality of rotary perforation. It is also possible to compare various types of rotary and stroke perforation, as well as the likelihood of re-perforation. Further, these analysis methods can describe other stamp edge profiles such as rouletted and die-cut separation.
Introduction
The analysis of perforation images was used recently to solve a mystery regarding forged extra perforation of 19th century U.S. revenue stamps (Mustacich, 2014). The focus of that effort was finding a way to measure inconsistencies in hole spacing to fingerprint each row of perforations, and determining if there was a single manufacture of these extra perforations. The studies described in this article apply these methods more broadly to investigate perforations, and extend the image analysis to include other types of separation.
This stamp image analysis research covers four topics: (1) Using statistical analysis of perforation features to reveal the quality of perforation over the history of U.S. federal stamp production, comparing the characteristics of different methods of perforation; (2) investigating possible stamp re-perforation; (3) applying perforation fingerprinting to modern issues; and (4) modifying the methods for the analysis of other types of stamp separation.
There are several interesting aspects of these topics. Since rotary perforators were such a difficult machine to manufacture, was there improvement in these machines over the history of perforation that is evident from examination of the stamps? For example, was there improvement that coincides with the initiative between the Bureau of Engraving and Printing and the National Bureau of Standards in the early 1980s to address the problems of manufacture? And then later, how did the transfer of perforation to private contractors in the late 20th century affect the observable characteristics of perforation? How do the characteristics of differently produced perforations compare? Example applications address several of these topics. These include suspected re-perforations, the fingerprinting of modern stroke-perforated U.S. stamps, the analysis of rouletted separations of early stamps of Finland, and the measurements of modern die-cut U.S. stamps.
Background and Approach
Philatelists are keenly aware of stamp separation, whether by perforation or other means. Since it is a key factor in judging the appearance of a stamp, it can specify stamp varieties, and it ultimately contributes to the valuation of the stamp. Modern philatelists quantify several types of separation using gauges, an innovation of the “French school” of early philatelists in the 1860s who introduced a method of gauging with no direct reference to the stamp (Williams and Williams, 1971). Using two centimeters as a typical stamp height, the modern gauge distance for counting the number of indentations was created. In the U.S., stamp experts often use the U.S. Specialist Gauge for their measurements (Weiss, 1994). Many modern gauges have continuous, sliding scales that allow measurement to fractional gauge, often in tenths.[1] Electronic devices are now commercially available which measure stamp gauge to the nearest ¼ or less.[2] This can also be accomplished by image analysis software which can use a variety of means to calculate a gauge from the image.[3]
While the use of basic gauges gained wide use after their introduction, philatelists did not widely appreciate that perforation equipment was neither designed nor manufactured to conform to the units of such a gauge. For example, the gauge of early U.S. Bureau of Engraving and Printing perforators was determined by the number of perforation pins that could be evenly spaced about the circumference of a standard steel cylinder. In the case of the flat plate printed, perf 11 Washington-Franklin stamps, this cylinder reportedly measured 4 inches in diameter (Weiss, 1994). For the early perf 12 stamps, a perforation wheel with 192 evenly spaced pins was known as a “Bureau 192” wheel (Leavy, 1918). Further, the amount of normal variation in the spacing of the separation features is often significant regarding fine measurement attempts, and this was also poorly understood by philatelists. The amount of this variation is difficult to determine with a standard gauge.
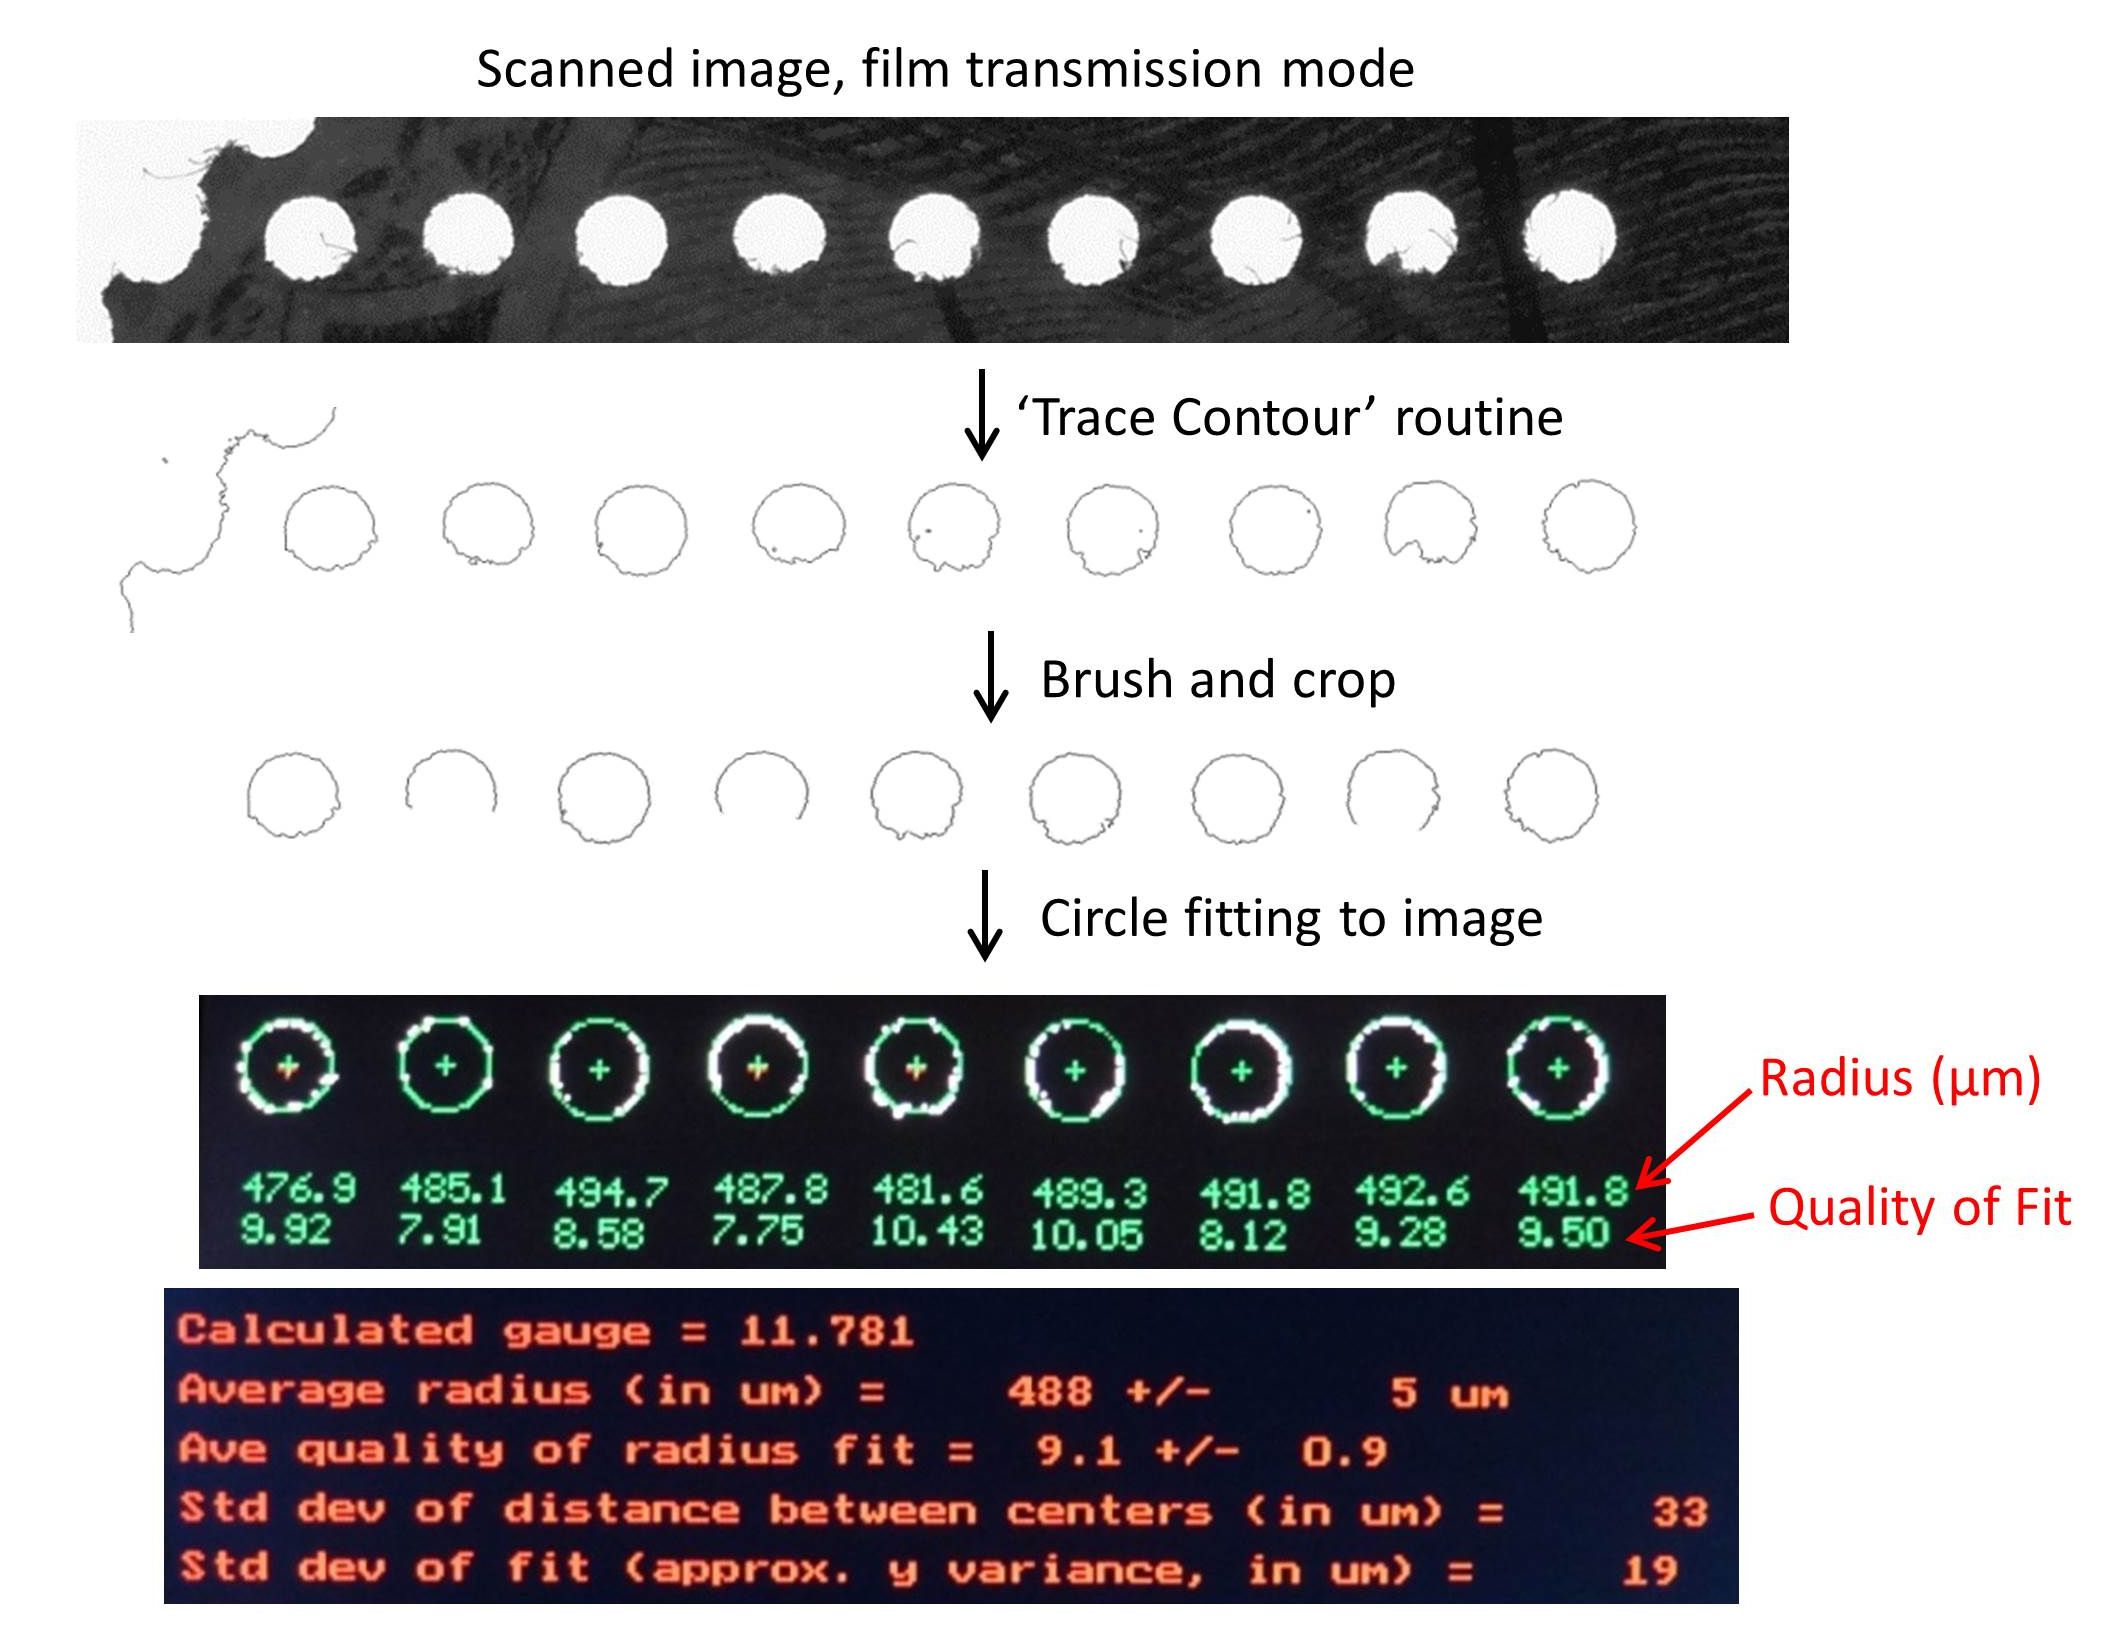
The author began his studies of perforation because the fake extra perforations on 19th century revenue stamps could not be differentiated from genuine perforations by gauge. A more comprehensive analysis of images of perforation was undertaken to characterize additional features such as the individual perforation hole sizes, the spacings between successive holes, the cut of the hole, and other irregularities of the perforation (Mustacich, 2014). Figure 1 shows the sequence of steps used in this approach. First, an image of a row of perforations is captured at high resolution in a transmission (“film scanning”) mode of a Canon 9000F flatbed scanner. A resolution of 2400 dpi in a gray-scale transmission mode was found optimal. The “Trace Contours” routine in Photoshop software (Adobe Systems Inc., San Jose, CA) sharpened the image of the hole edges. This sharp edge definition resulted in a higher precision fit of circles to partial data arcs that occur with separated stamp edges. A computer program written by the author scanned the images with a mask to locate holes of the approximate size of interest starting at one edge of an image.
Figure 1. The method of analysis starts typically with a 2400 dpi transmission scan using a flatbed scanner with a film mode. The edge profiles of the perforation holes are extracted with software, and then custom software fits circles to the row of holes in the image with micron-level precision because of the two-dimensional fitting process. The software provides statistical results for the radius, hole spacing, quality of fit, and out-of-line deviation.
When a hole was found, a circle was fit to the image of the edge using a linear least squares method (Coope, 1993). While ± 1 pixel of linear resolution at 2400 dpi is ± 11 µm, a two dimensional fit at high resolution gives a precision better than 1 µm in terms of radius and coordinates in the image. This process is repeated over the length of the image to determine the hole sizes and locations for the entire row of perforations. The accurate, two-dimensional measurement of the hole centers in the row of perforations provides statistical information such as the distribution of hole-to-hole spacings, average hole spacing (the gauge), the distribution of radii, and the distribution of transverse error from a line drawn through the centers of the holes (“zig zag error”). The sequence of the hole spacing provides an especially useful type of fingerprint. Further, the mathematical fit of a circle to the edge image of each hole gives an error measure of how much the image of the hole edge deviates from a perfect circle. While significant ellipticity was not observed with transmitted light, the roughness of hole cut varies greatly. I created the term the “hole fit error” (HFE) for this measure. Small error values are typical of sharply-cut circular holes, while rough hole edges result in higher values of the HFE (Mustacich, 2014).
In this research, entire sheets were manually scanned in short segments up to a length of 56 mm, the image width that can be viewed horizontally in the film transparency adapter of a Canon 9000F flatbed scanner. After manually pre-processing the images to extract edges, these images could be analyzed in a batch file operation, and the overall statistics were determined for the perforation of an entire sheet.
The Analysis of Perforations – Past to Present
All of the perforations were measured for entire sheets. [4] 28 sheets were studied covering a time span from 1914 to 2007, along with a single example from the First Issue revenue stamps of 1862. All sheets were with gum. Separate statistics were determined for each direction of perforation on the sheets. Figure 2 shows the results for the distributions of hole size, hole spacing, and HFE for the block of First Issue 1 cent Proprietary revenues. Plotting of the vertical perforation data (“columns”) is in blue and the horizontal perforation data (“rows”) is in red. Colored lines show average values. The early perforators used in the U.S. were rotary machines consisting of wheels with pins and matching wheels with holes. Perforation was accomplished in one direction at a time (“1-way perforation”) by passing the sheets of stamps between these matching sets of rotating wheels.[5] Different configurations of the wheel spacings were required for perforating the two directions of the sheet since the stamps were not square. The distributions of the hole radius in the horizontal axis on the graphs show substantial differences, indicating the use of different 1-way perforators for each direction. The angled skew of the HFE data versus hole radius observed on many plots is thought to simply be the result of rough-cut holes having smaller-appearing hole sizes. In extreme cases, a bit of remaining paper in the hole from poor punching clearly reduces the effective hole size. Hole cut roughness is common with the earliest perforation because the perforators could only be machined to looser specifications for pin-to-hole clearance than more modern machines (U.S. Bureau of Engraving and Printing, 2013).
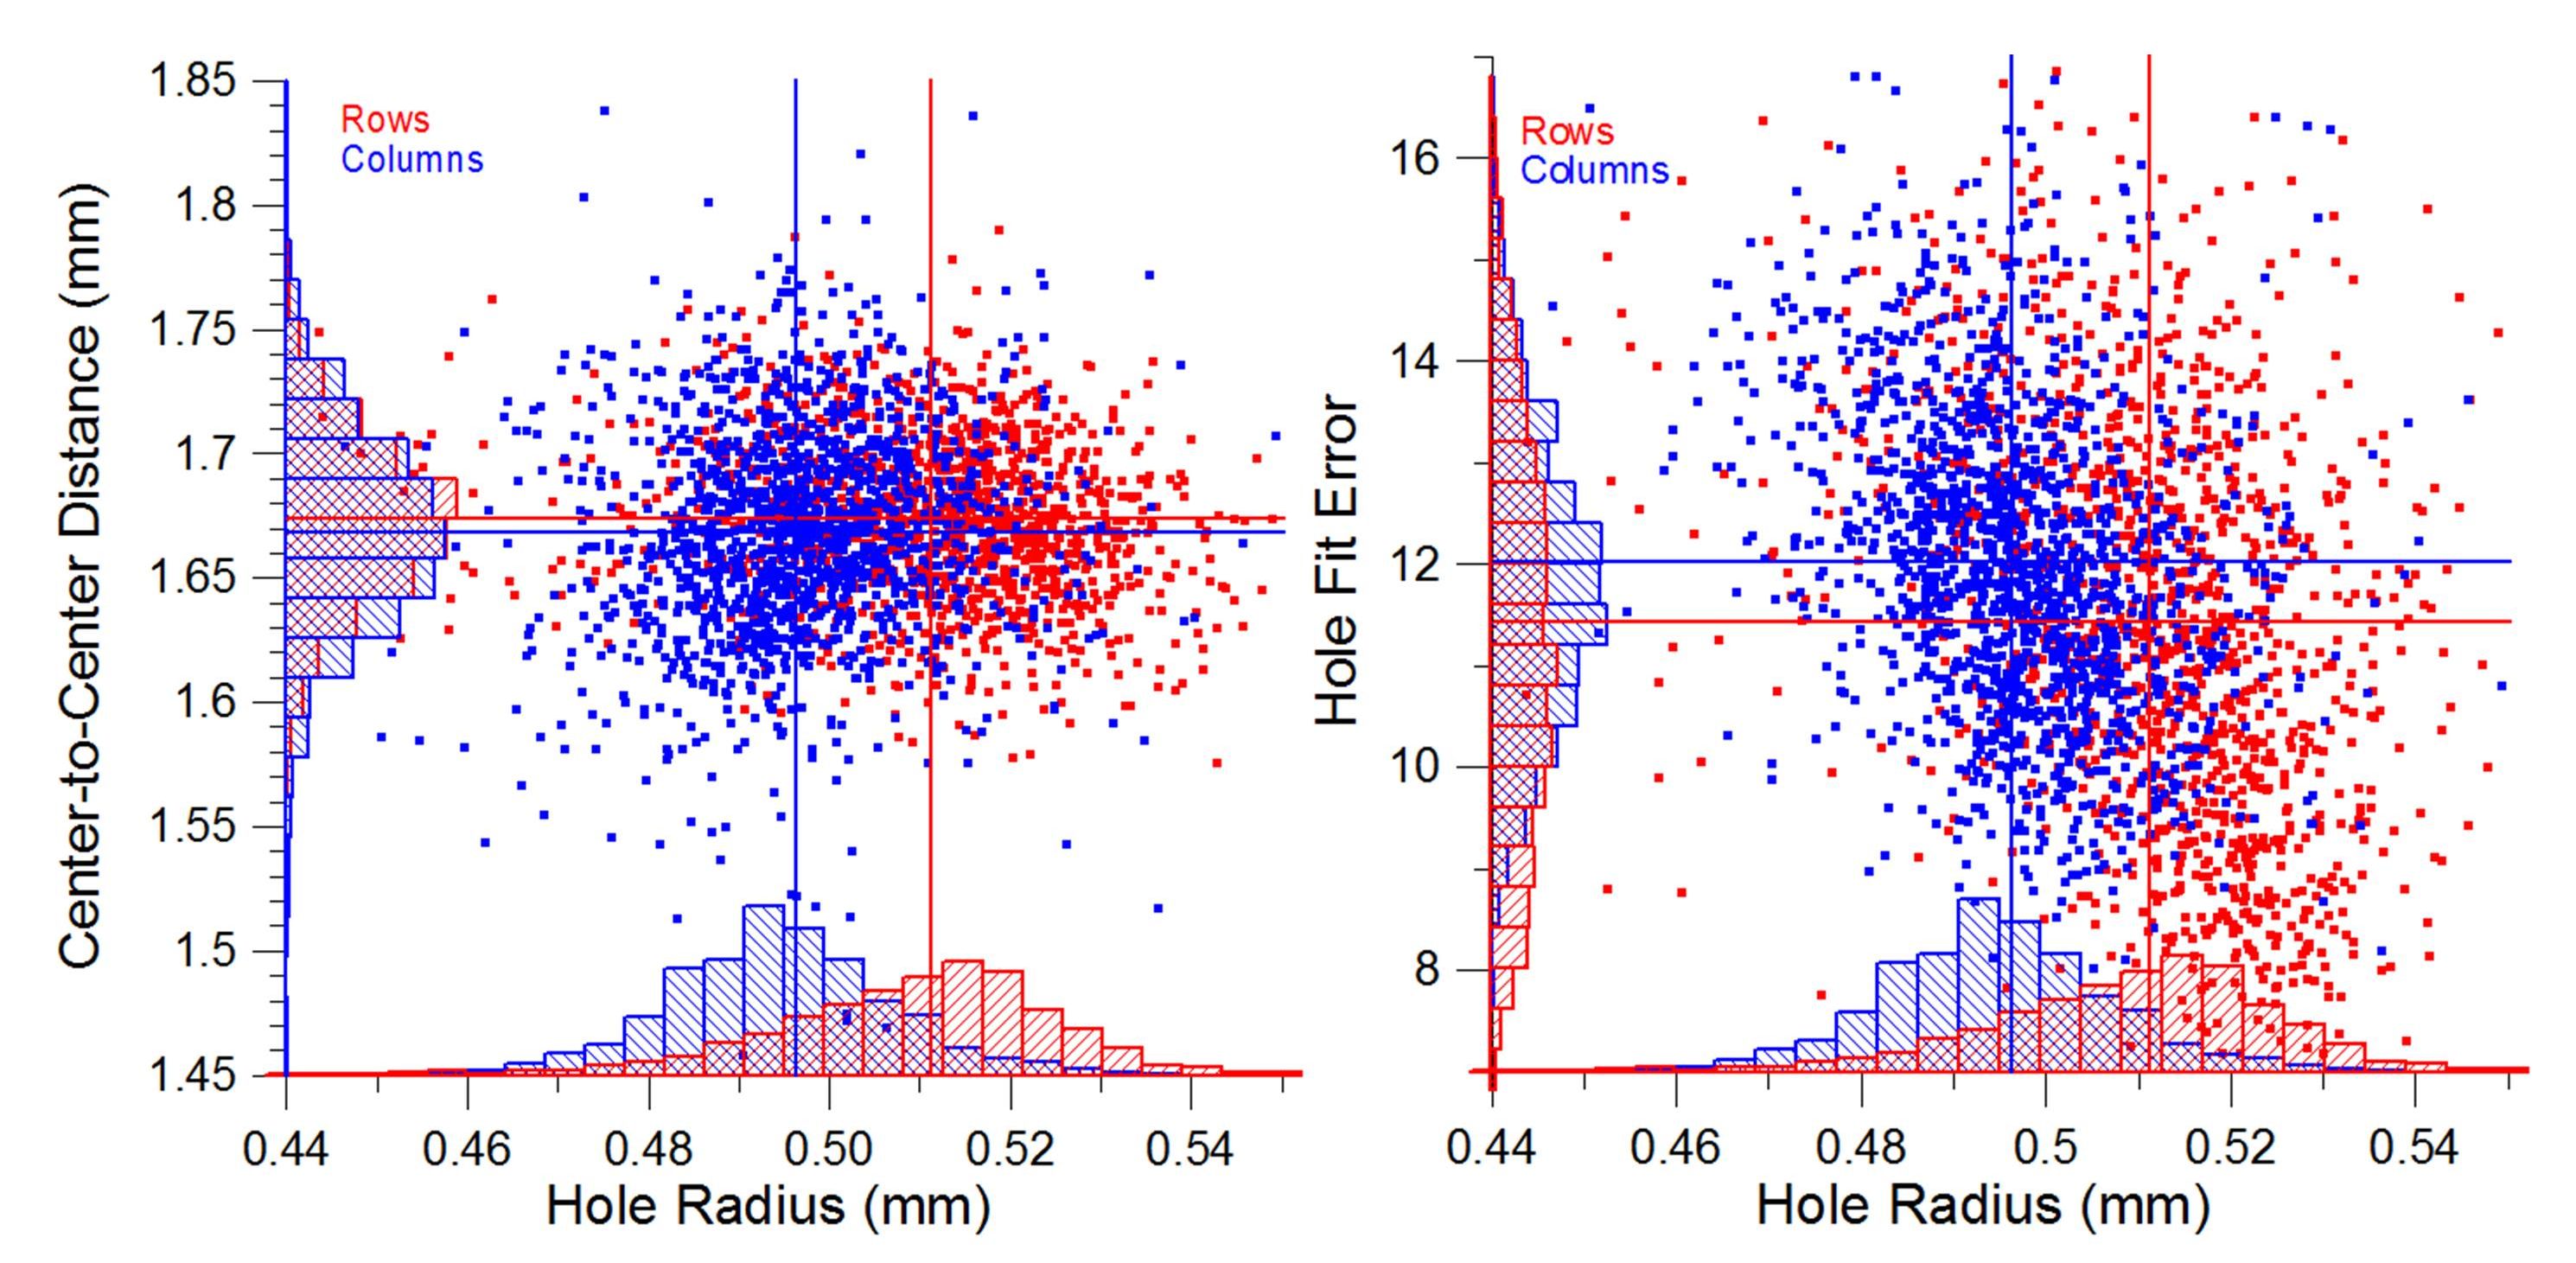
Figure 2. Plots showing the distributions of hole spacing and hole fit error vs. the distributions of radius for the horizontal and vertical rows of perforation in a block of 120 of the U.S. 1 cent Proprietary First Issue revenue stamp. A large amount of variation is evident in the perforation of these early stamps, and the two “1-way” perforators differed in their distributions of the hole radii.
Stepping forward to 1914 and 1919, an analysis of sheets of revenue stamps, the offset printed Cordials, Wines, Etc. 8 cent (wmk. 191R) and the 2 cent Proprietary revenue, show very similar distributions and standard deviations to those shown in Figure 2. There appears to be little difference in the rotary perforation of these sheets.
The development of the electric eye perforation process in the 1930s had a major impact on waste reduction, reducing spoilage from approximately 35% to about 1% in 1940 using the electric eye perforators (Williams and Williams, 1971). The electric eye perforator consisted of a 1-way perforator followed by a second set of wheels fitted with bars and pins arranged similarly to the paddle wheel of a steamboat. This second set of wheels spanned by bars created perforations across the sheet. Since both directions of perforation were punched in a single pass of the sheet, the electric eye perforator was a so-called “2-way” perforator. Figure 3(a) shows the analysis of a sheet of experimental electric eye perforation of the 1935 Washington 2 cent stamp (plate no. 21149). There is a difference in the radius distributions in the two different directions, and there is a large difference in the hole spacing distributions because of the different gauges (10.5 x 11.2). The HFE distributions are similar for the two directions on this sheet, and both exhibit a moderate amount of skew due to roughness of the hole cut.
Figure 3(b) advances 15 years to an example of electric eye perforation of the1950 Statue of Freedom stamp. The radii and the hole spacings have narrower distributions. Compared to previous examples, the hole cuts are sharper as shown by smaller peak distribution values of approximately 10 for the HFE. Five electric eye perforators were built under contract in 1941 by the Harris Seybold Co. (Williams and Williams, 1971). These were manufactured under very exacting conditions with specially built machines operated in an air conditioned room in the Cleveland factory. Experts who have witnessed their manufacture reported that they required the closest-tolerance production machining being done in the United States (The U.S. Bureau of Engraving and Printing, 2013b). This new generation of perforators at the BEP accounts for the reduced variation in the perforation. Similar results were found analyzing a sheet of the 1960 Communications for Peace stamps.
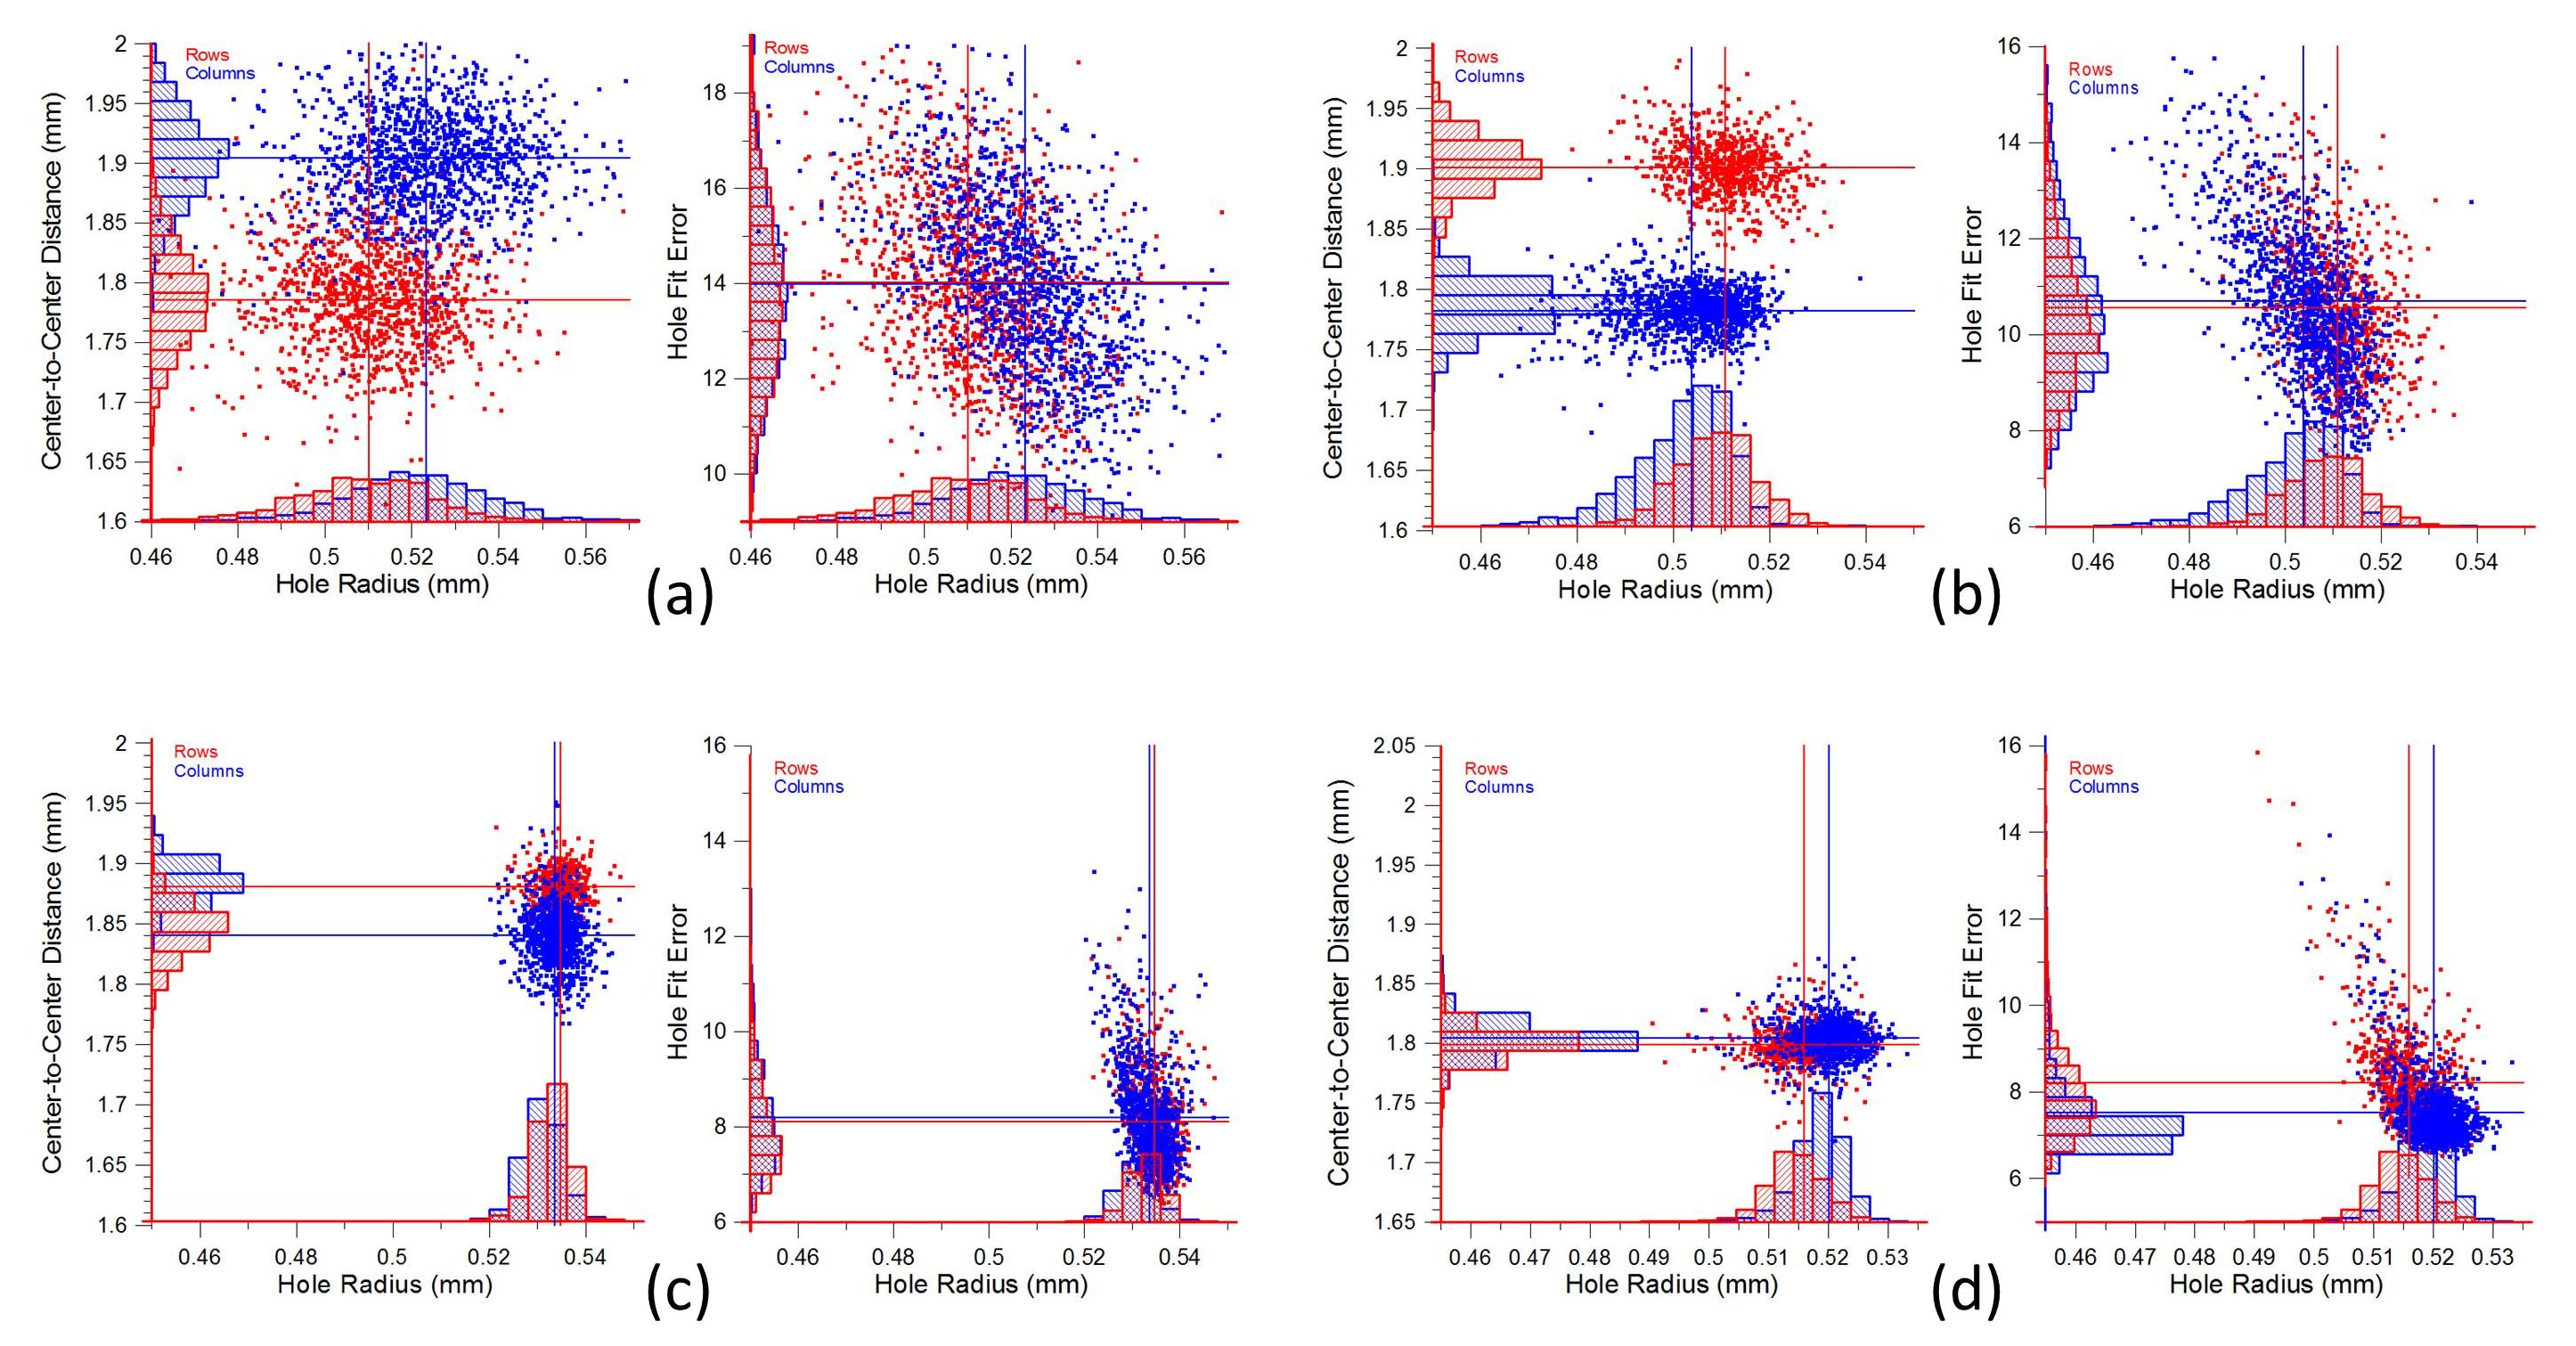
Figure 3. Similar plotting of the perforation characteristics determined from sheets of stamps for the following U.S. stamps: (a) The experimental electric eye perforated 2 cent Washington stamp of 1935; (b) the 1950 Statue of Freedom stamp; (c) the Van Eyck Christmas stamp of 1968; and (d) the 1975 Prang Christmas stamp perforated in-line on the Andreotti press. Both (c) and (d) used in-line rotary harrow perforation.
In 1968 the BEP installed a new generation of press, the nine-color Huck press, which included in-line perforation. The perforation was of a rotary harrow design producing perfect corners on the stamps. The analysis of an example of the perforation from this press is shown in Figure 3(c) for the Van Eyck Christmas stamp of 1968. There is a significant reduction in the hole spacing and radius distributions. In-line rotary harrow perforation was added to the Andreotti press in 1975. Prior to this time, stamps printed on the Andreotti press were perforated off-line with a Seybold electric eye rotary web-fed perforator (Hotchner, 1989). One of the 1975 issues that was rotary harrow-perforated in-line with the Andreotti press was the Christmas card stamp featuring an early design by Louis Prang. This stamp is well known for being the first of the modern multiple perforation issues (Kitson, 1988). The example in Figure 3(d) shows the analysis of the rotary harrow-perforated variety of this stamp. The distributions of the radii and the hole spacing are similarly narrow. Median values of 8 or less show that the holes are sharply cut; however a few of the holes have some irregularities that result in a skewed scatter plot for a small portion of the data. The electric eye perforated 1975 Prang Christmas card stamps provided measurements similar to the electric eye perforated example in Figure 3(b). The L perforated stamps of this issue exhibited distribution widths more similar to the harrow perforated stamps in the horizontal direction, and distributions more like the electric eye perforated stamps in the vertical direction.
The demand by the BEP for contractors to meet ever smaller tolerances in the manufacture of perforation cylinders led to a shortage of bidders in the 1970s. For some time the only willing bidder for hand-crafted cylinder sets was an Italian firm, but with delivery times on the order of two and one half years. When it became clear that the Italian firm could not deliver harrow perforation cylinders for a large sheet of stamps with irregular sizes for a scheduled philatelic exhibition in Canada, the BEP turned to the National Bureau of Standard (NBS) for help. NBS agreed to take on the job on a best efforts basis, provided the BEP funded the effort. The tolerance specification was relaxed from the requested 0.001 inches to 0.002 inches, a tolerance NBS still considered beyond their current capabilities. NBS assembled a team that produced a pair of the cylinders to the 0.002 inch tolerance just in time for the BEP to produce and deliver half of the promised sheets on the first day of the exhibition (NIST, 2001; Bergstrom, 1984). From the descriptions in these references it appears that the exhibition sheet was for the 1978 Canadian International Philatelic Exhibition in Toronto. [6] Figure 4(a) shows measurements from one of these sheets. If this was the product of an early pilot effort by NBS, it appears that they achieved results very similar to the quality of the previous rotary harrow perforations shown in Figures 3(c) and 3(d).
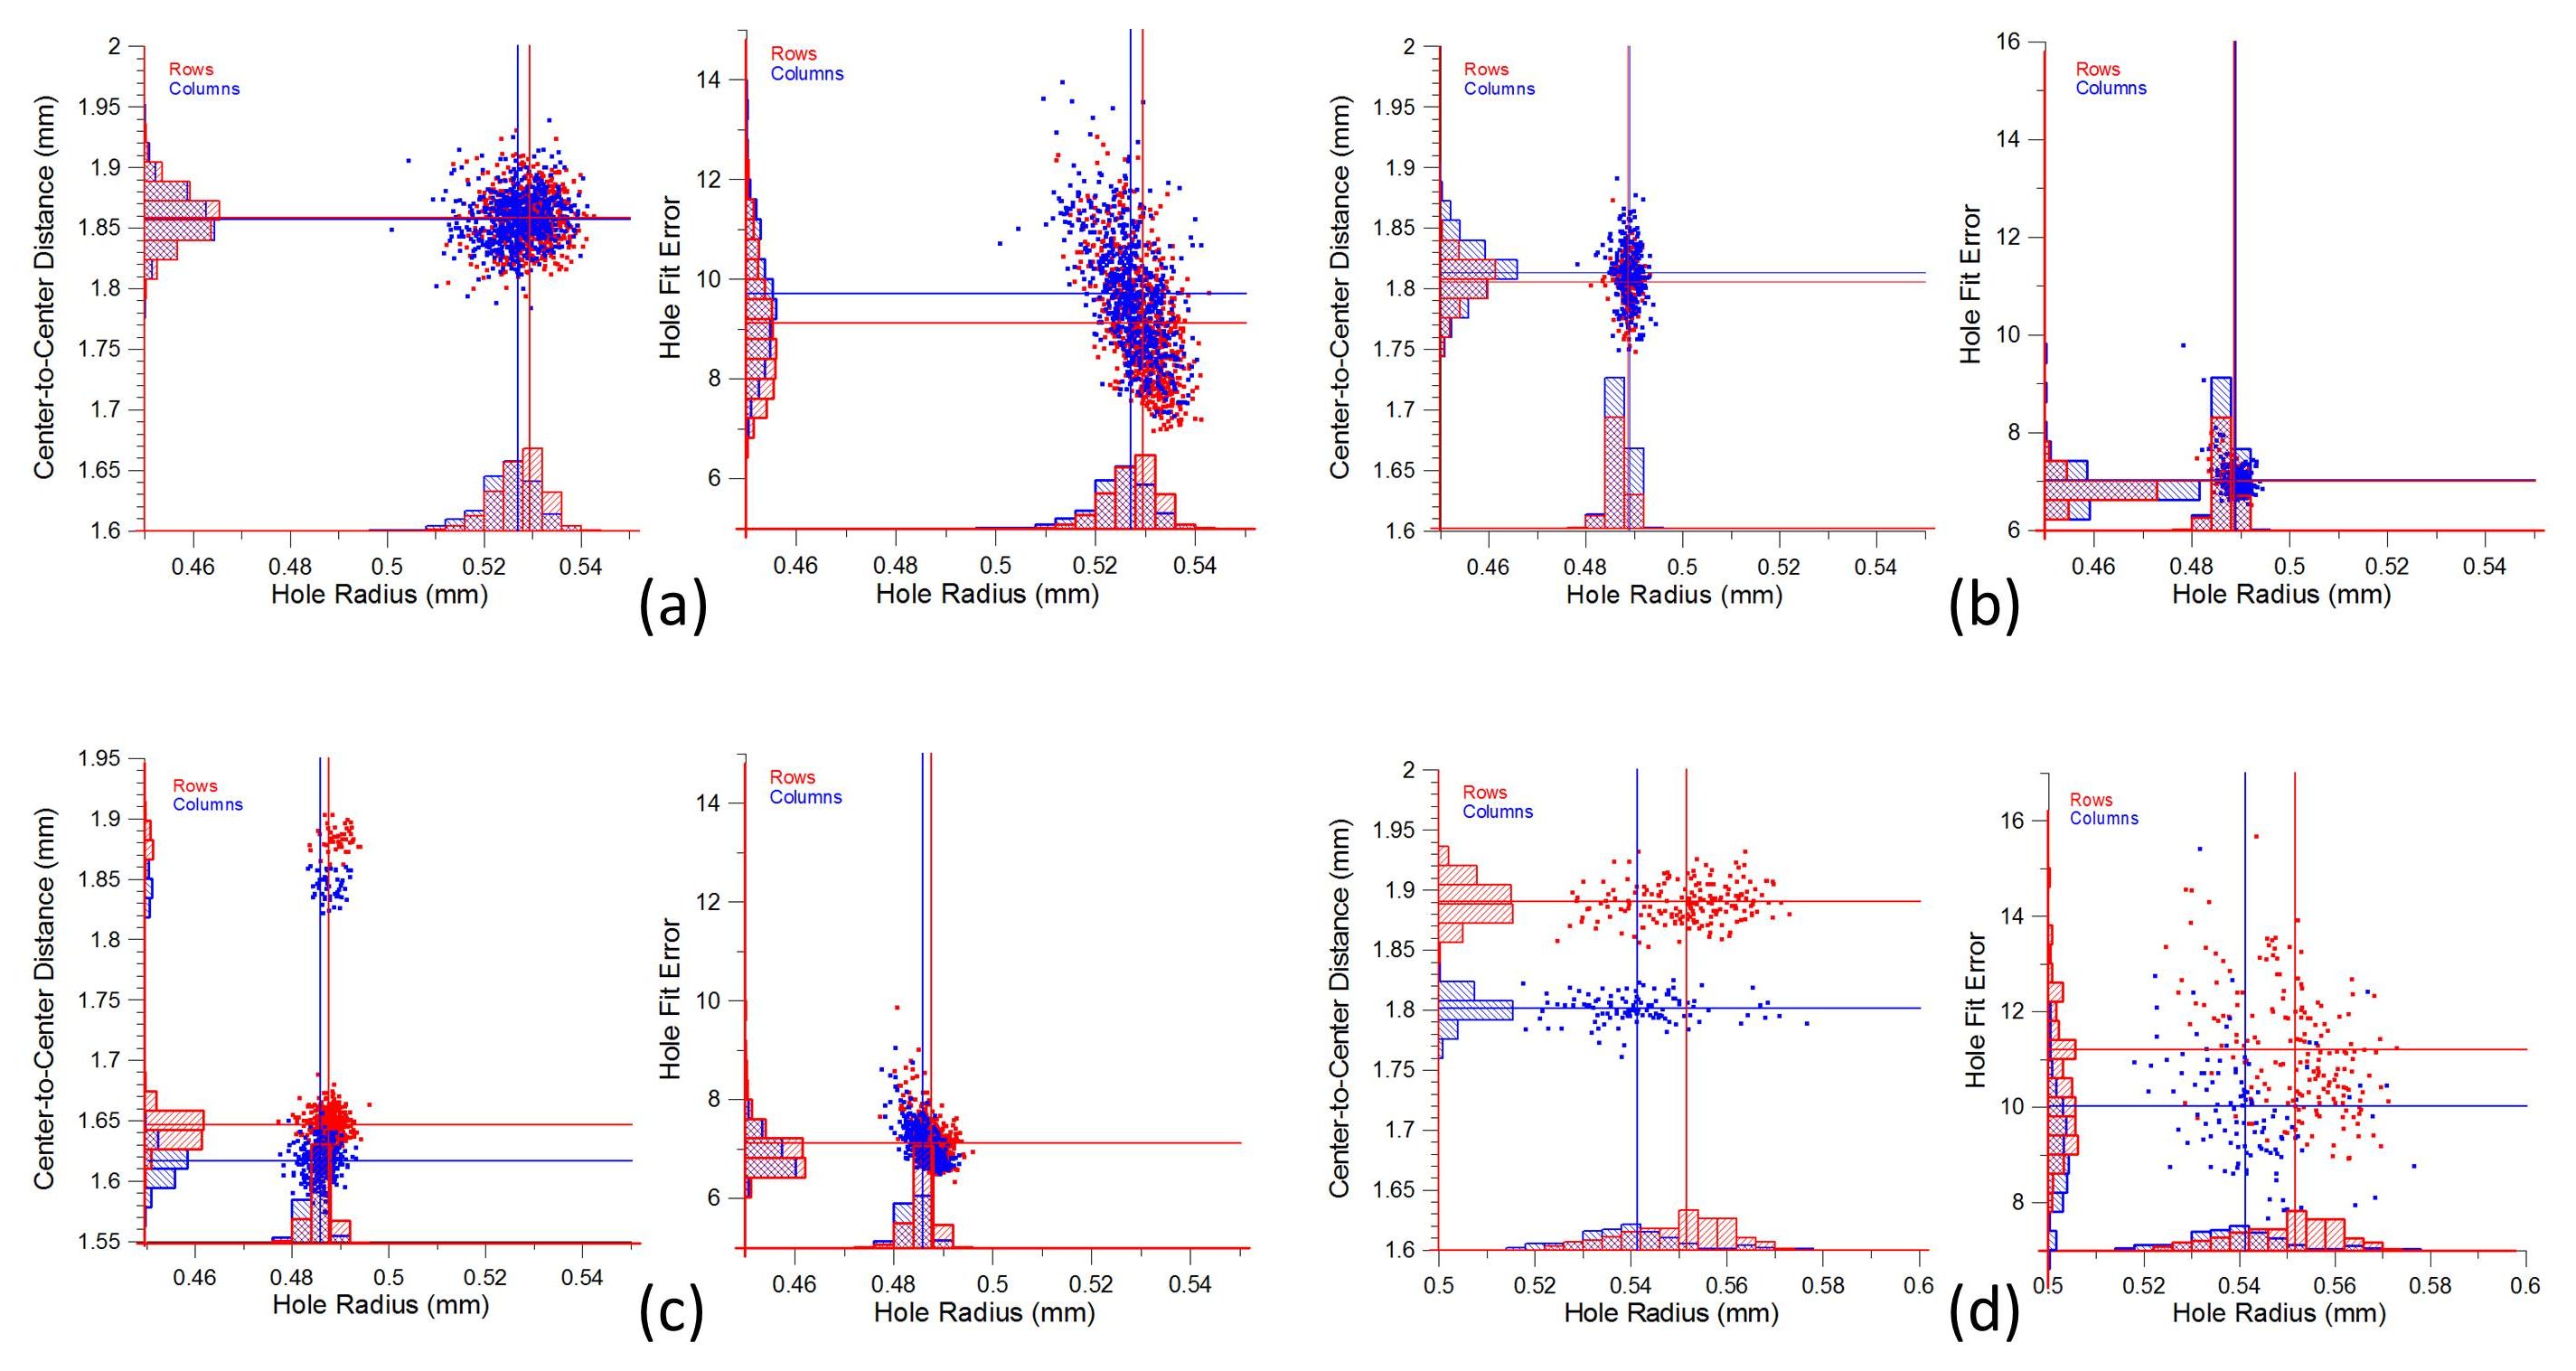
Figure 4. Similar plotting of the perforation characteristics determined from sheets of stamps for the following U.S. stamps: (a) The 1978 Canadian International Philatelic Exhibition sheet; (b) the 1986 Ameripex sheet (Scott no. 2216); (c) the Trans-Mississippi Centennial sheet of 1998; and (d) the Probing the Vastness of Space from year 2000 (Scott no. 3409). (a) and (b) are rotary harrow perforated, while (c) is stroke perforated, and (d) is an alternative method of rotary perforation.
The late 1970s effort by NBS to machine perforation cylinders set in motion a project at NBS to meet the challenge of the original 0.001-inch tolerance limit. Two private industry companies had already failed in their attempt to develop drilling machines to meet this target. Using numerically-controlled machining to account for 23 different sources of error with an array of sensors, controlled-temperature environments, and new methods to detect drill bit fatigue, the NBS developed the astounding capability to drill one of these cylinders with 16,844 holes 8.13 mm deep of 1.09 mm diameter in 40 hours to these specifications. Based on their instrumentation control developments, the ability to achieve an accuracy of ±0.0002 inch seemed possible (Bergstrom, 1984). The timing and the dissemination of the NBS results to potential BEP contractors is not clear, but these efforts surely factored into the ongoing efforts to manufacture improved perforators.
However, it appears that the speed of perforation has always been trying to catch up to the speed of printing presses. Production bottlenecks, especially with in-line perforation which could slow or halt a press, were a perpetual problem. For this reason, the BEP made the decision in the 1980s to perforate off-press as much as possible, and to purchase new presses without in-line perforators (Hotchner, 1989). So for stamps later than the 1970s, an increasing array of equipment and parties were involved in the production and perforation of stamps, especially as more production was contracted outside of the BEP.
In 1985 the Bobst-Champlain perforator was introduced using a Eureka bullseye die for off-line stroke perforation. In the stroke process, pins in a bar or plate descend linearly to perforate the paper, analogous to the common 3-hole paper punch. Figure 4(b) shows the analysis of a sheet from the 1986 Ameripex issue, sheet I, perforated by this process. It is immediately apparent that the distributions of hole radius and HFE are both very narrow, with a small amount of spread in the hole spacing. In fact, the holes are exceptionally well cut and have some of the smallest HFE values observed. The results are very similar with the 1995 American Kestrel 1 cent stamp, also perforated with the Eureka die. While it also shows similarly sharp cut holes, it also shows more spread in the distribution of the hole spacings.
Figure 4(c) shows another example of an off-line stroke perforator used on U.S. stamps, the Wista BPA 9070 stroke perforated Trans-Mississippi Centennial sheet of 1998. The gauge is approximately 12.2 x 12.4 for the stamps, with a few more widely-spaced holes filling the gaps in the sheet between the nine stamps. The distributions are narrow for the radii, HFE, and the hole spacings in this case. Analysis of examples of Wista stroke perforation for the 2001 Enrico Fermi stamp and the 2002 Hawaiian Missionary stamp show very similar results to those observed in Figure 4(c). In the steady transition to die cut stamps from perforated stamps, one of the late examples of perforation is the 2007 Flag stamp. This Wista stroke-perforated stamp has more spread in the hole spacings than the other three Wista stroke- perforated examples discussed and some slight skew and roughness to a small number of the holes, but is otherwise similar to the other Wista perforated examples.
The analysis of a recent rotary perforated stamp with very different characteristics is shown in Figure 4(d). This example, the 2000 Probing the Vastness of Space sheet, was perforated with the Ab Production Svenska (APS) rotary perforator. This perforator uses a method related to the Swedish “lawnmower”; the paper is indented from the front and then cut on the backside with a cylindrical cutter (Myall, 2003). This process leaves a small amount of raised powdered paper and gum on the backside of the stamps. The indenting and cutting results in a large hole radius.
Figure 4(d) shows a relatively wide dispersion of radii and HFE, evidently resulting from variation in this process. The distribution of hole spacings is relatively narrow, though. An analysis of another APS rotary-perforated stamp, the 1998 American Folk Music (Folk Singers) issue, shows very similar results, but with less spread in the values for the radii and HFE for perforation in the horizontal direction.
Table 1 contains a tabulation of the results for the 29 sheets of stamps. For each issue this table includes the separate statistical averages and standard deviations of the characteristics of the vertical and the horizontal perforations. The table presents these characteristics in the following order: the average radius (R) and the standard deviation of the radii (σR), in mm; the average spacing (d) and the standard deviation of the spacing (σd), in mm; the gauge calculated from the average spacing; the average hole fit error (HFE), and the standard deviation of the HFE (σHFE); and the standard deviation of the transverse (“zig zag”) error ( , in µm; next, this information then repeats for the other perforation direction; and a description of the type of perforator used, where “R 1-way” denotes a basic uni-directional rotary perforator, “R 2-way” denotes perforation accomplished in both directions in a single pass such as the electric eye perforator, R denotes rotary perforation of unspecified type, RH denotes rotary harrow perforation, and S denotes stroke perforation.
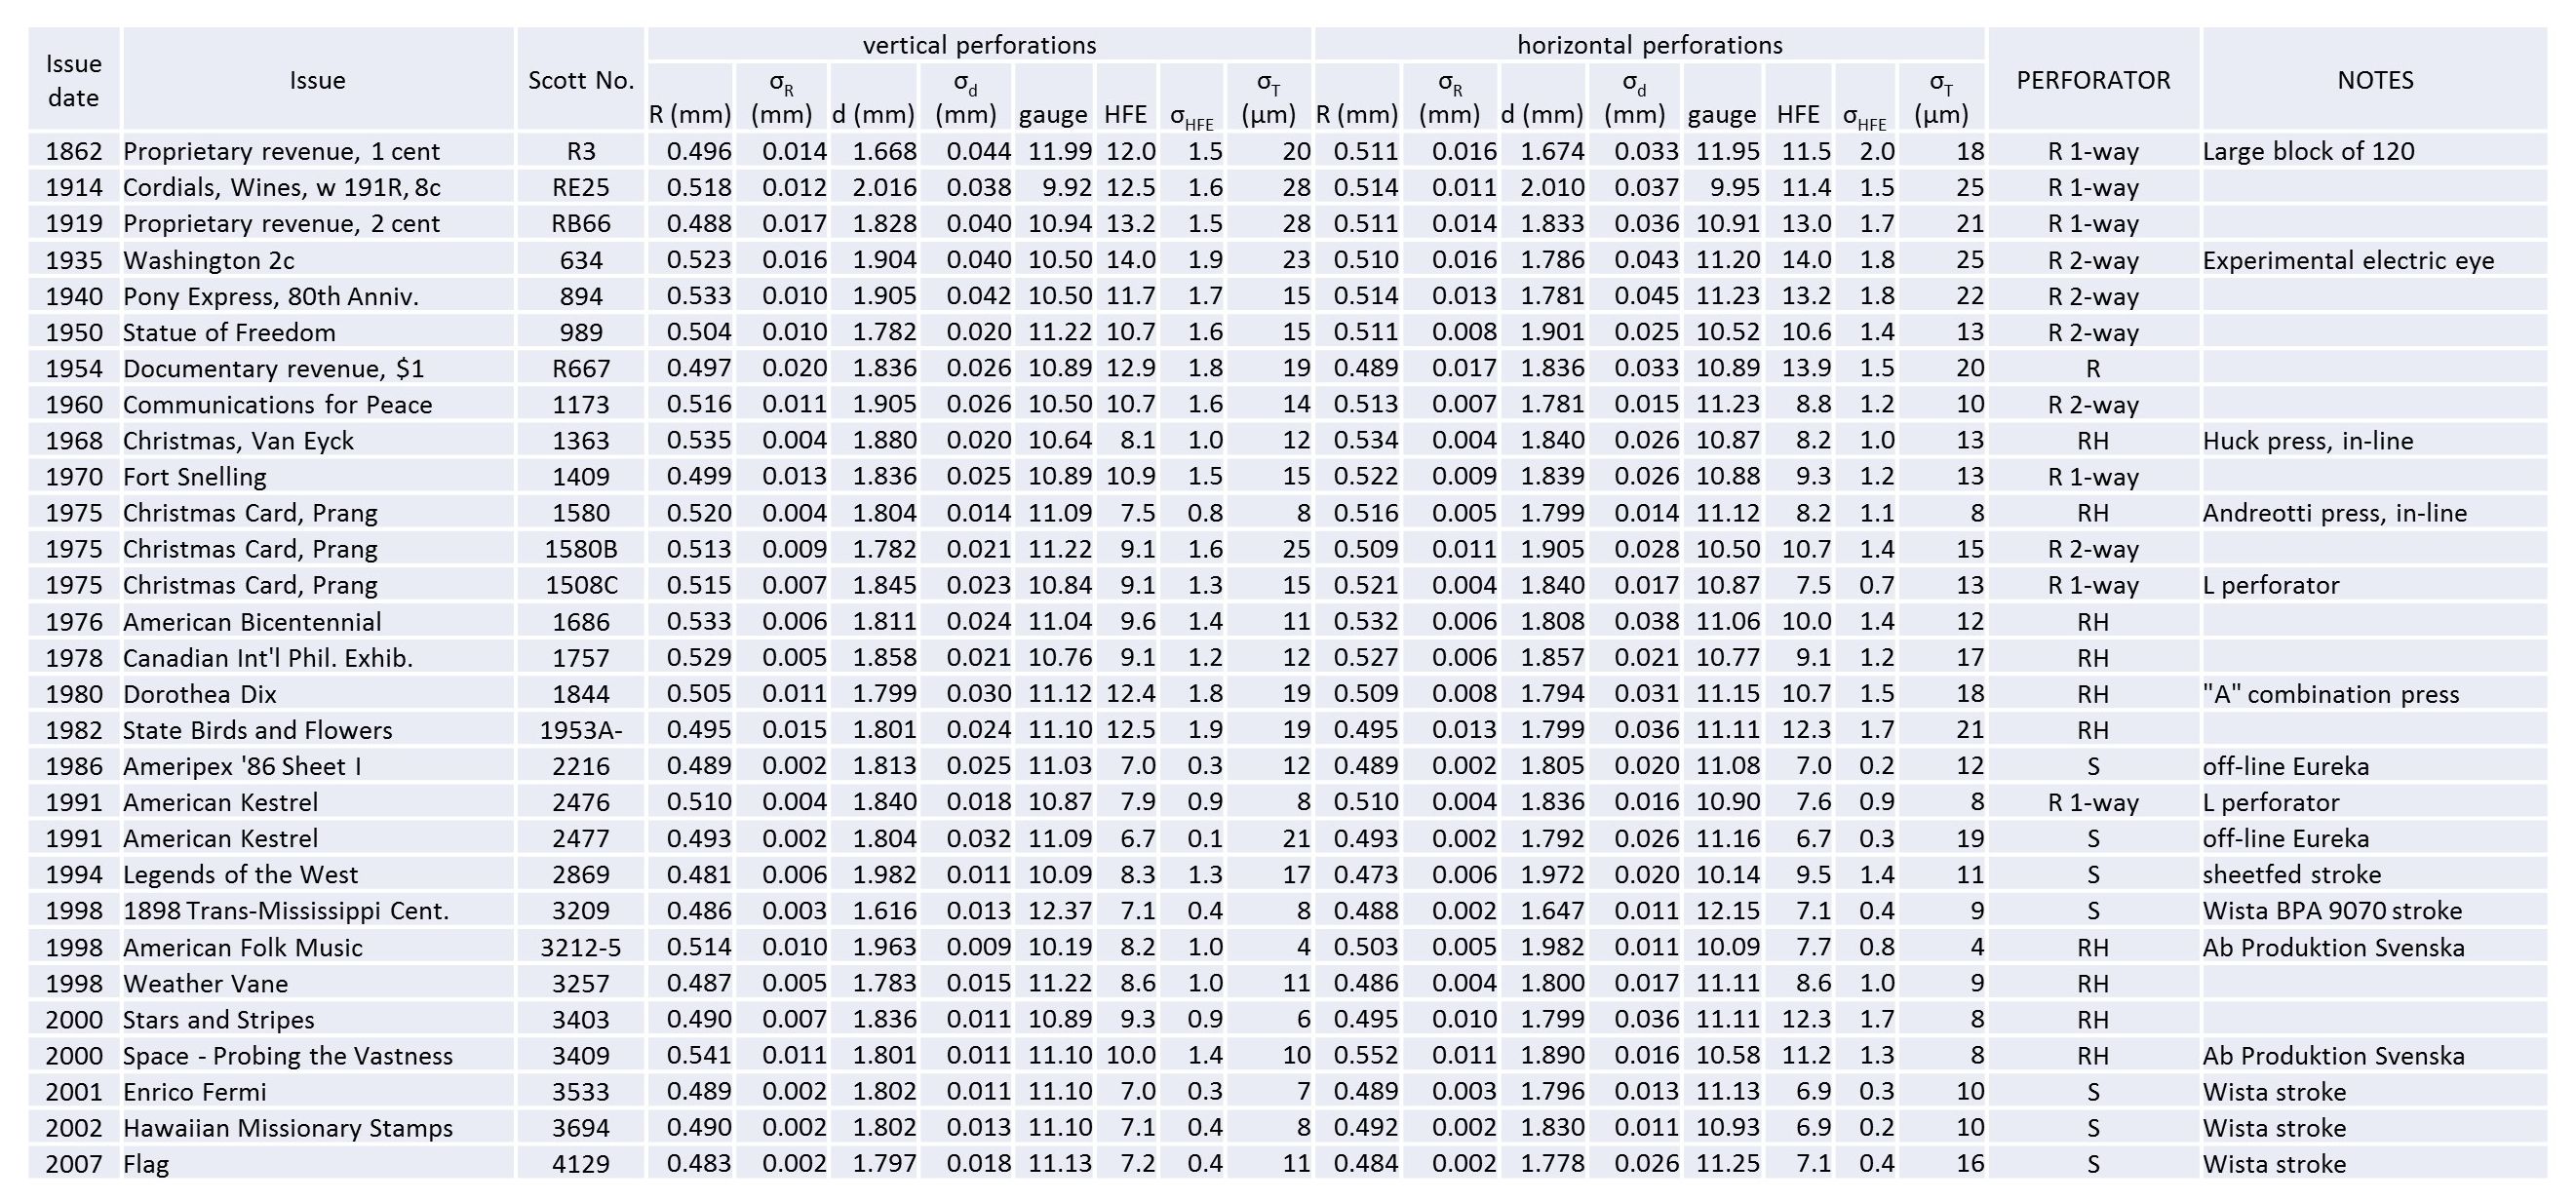
Table 1. Measurements from a survey of 29 different sheets of stamps. Separate statistics were calculated for vertical and horizontal perforations on the sheets. The table contains the following sequence of information for each direction of perforation: The average value and standard deviation of the radius in mm; the average value and standard deviation of the hole spacing in mm; the calculated gauge; the hole fit error (HFE) and its standard deviation; and the standard deviation of the transverse (“zig-zag”) error in µm.
Figure 5 presents plots of the standard deviations of the hole placements for post-19th century examples contained in the table. As mentioned above, the 1941 production of the electric eye perforators by the Harris Seybold Co. met new standards of precision in temperature controlled environments. This is evident in the reduced sizes of deviations in both hole spacing and zig-zag error due to improved precision in hole placement. After this innovation, little changed in rotary perforators until after 1980. There was an overall reduction in the variance of the hole spacing in rotary perforators after the early 1980s BEP-NBS program based on the sheets tested in this study. There was also reduction in the transverse hole placement error.
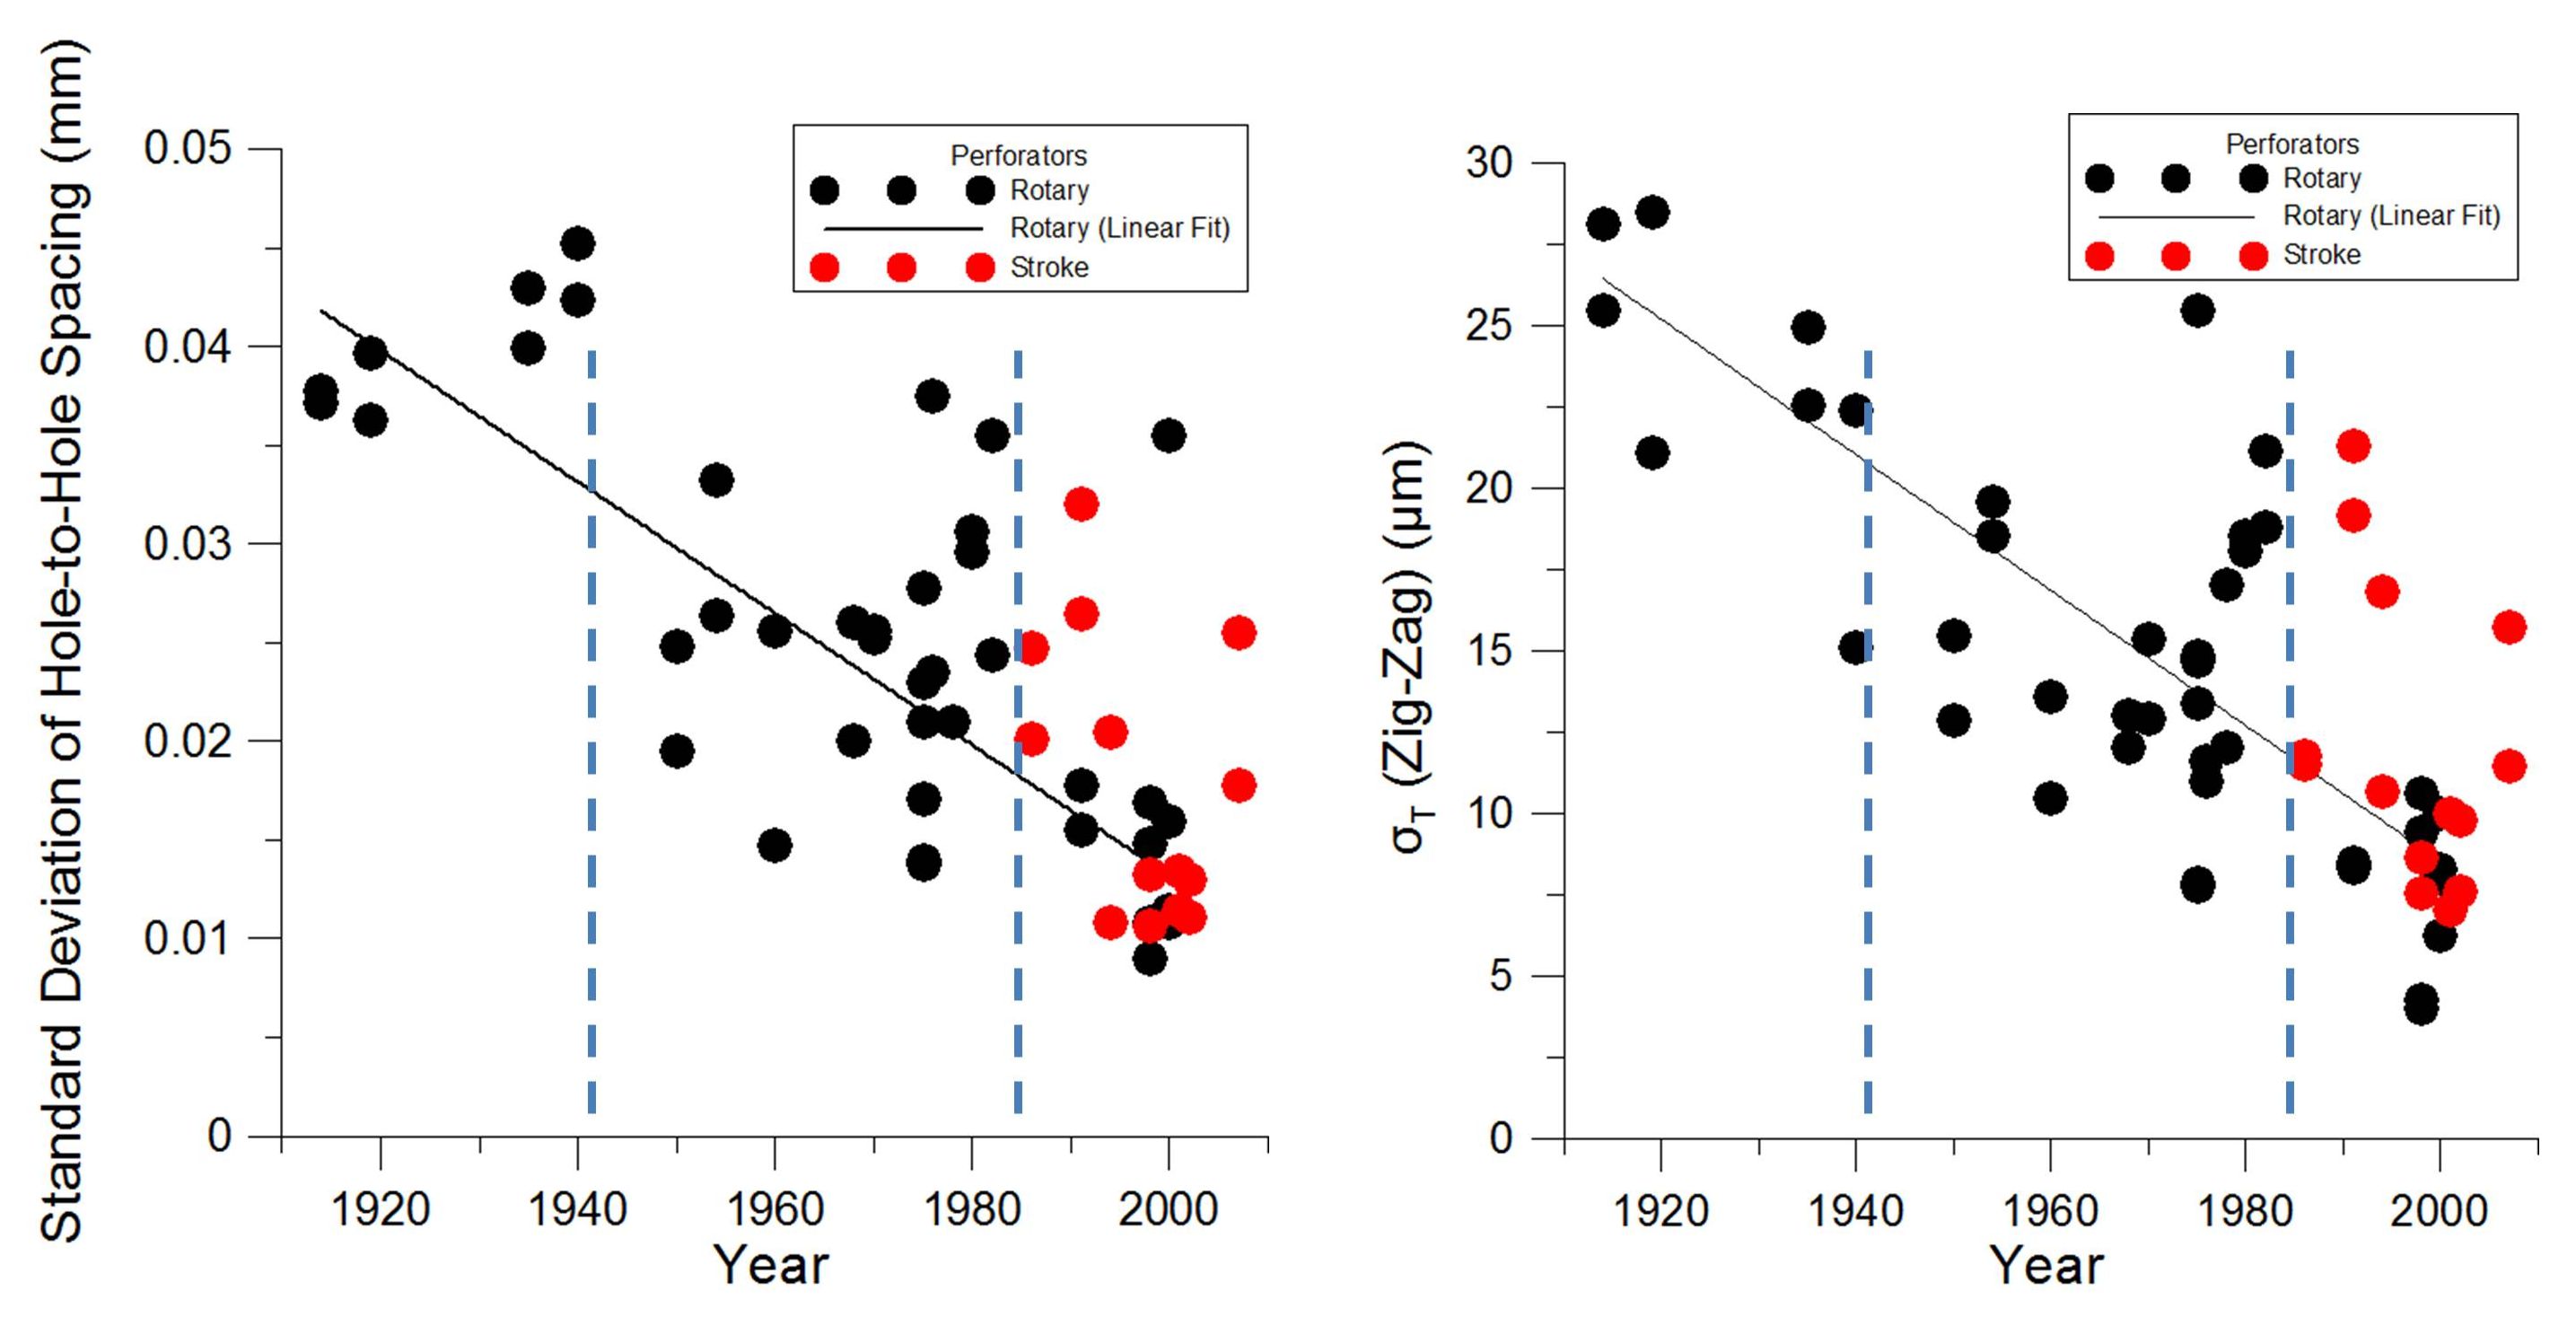
Figure 5. Plots showing the improvement over time in the precision of hole placement in rotary perforation as revealed from the characterization of sheets of stamps. Both the standard deviation of the hole spacing and the transverse (zig-zag) show reductions that correlate with two documented improvements to perforator fabrication: (1) the environmental control of temperature during machining in 1941; and (2) the numerically controlled machining project at the National Bureau of Standards for manufacturing perforators in the early 1980s.
The BEP-sponsored NBS program spawned a number of award-winning improvements to the field of precision machining (NIST, 2003); the data in Figure 5 suggests that the program did have an impact on the machining of rotary perforators. By 2000, the level of precision had risen to match the best of the stroke perforators. If we consider the rotary perforators to be intrinsically more difficult to machine, this data speaks highly of the precision gains realized in fabricating rotary perforators.
The hole radius of the perforation is approximately constant over this time span as shown in Figure 6. The BEP does not have pin diameter information for perforators prior to 1940, but stated that a pin diameter of 0.042 inch (533 µm) has been standard since that time, with target hole diameters of 0.043 inch (546 µm), at least as of 1964 (BEP, 2013a). A curious fact is that punched hole sizes tend to be nearly the size of the pins, but can be smaller than the actual pin size (BEP, 2013a; Mustacich, 2015). [7] On average the rotary perforations through 1991 in the table show a radius about 4% less than the standard pin. The stroke perforators appear to have a metric pin diameter of 1 mm, and observed hole size similarly about 3% less than the pin size. [8]
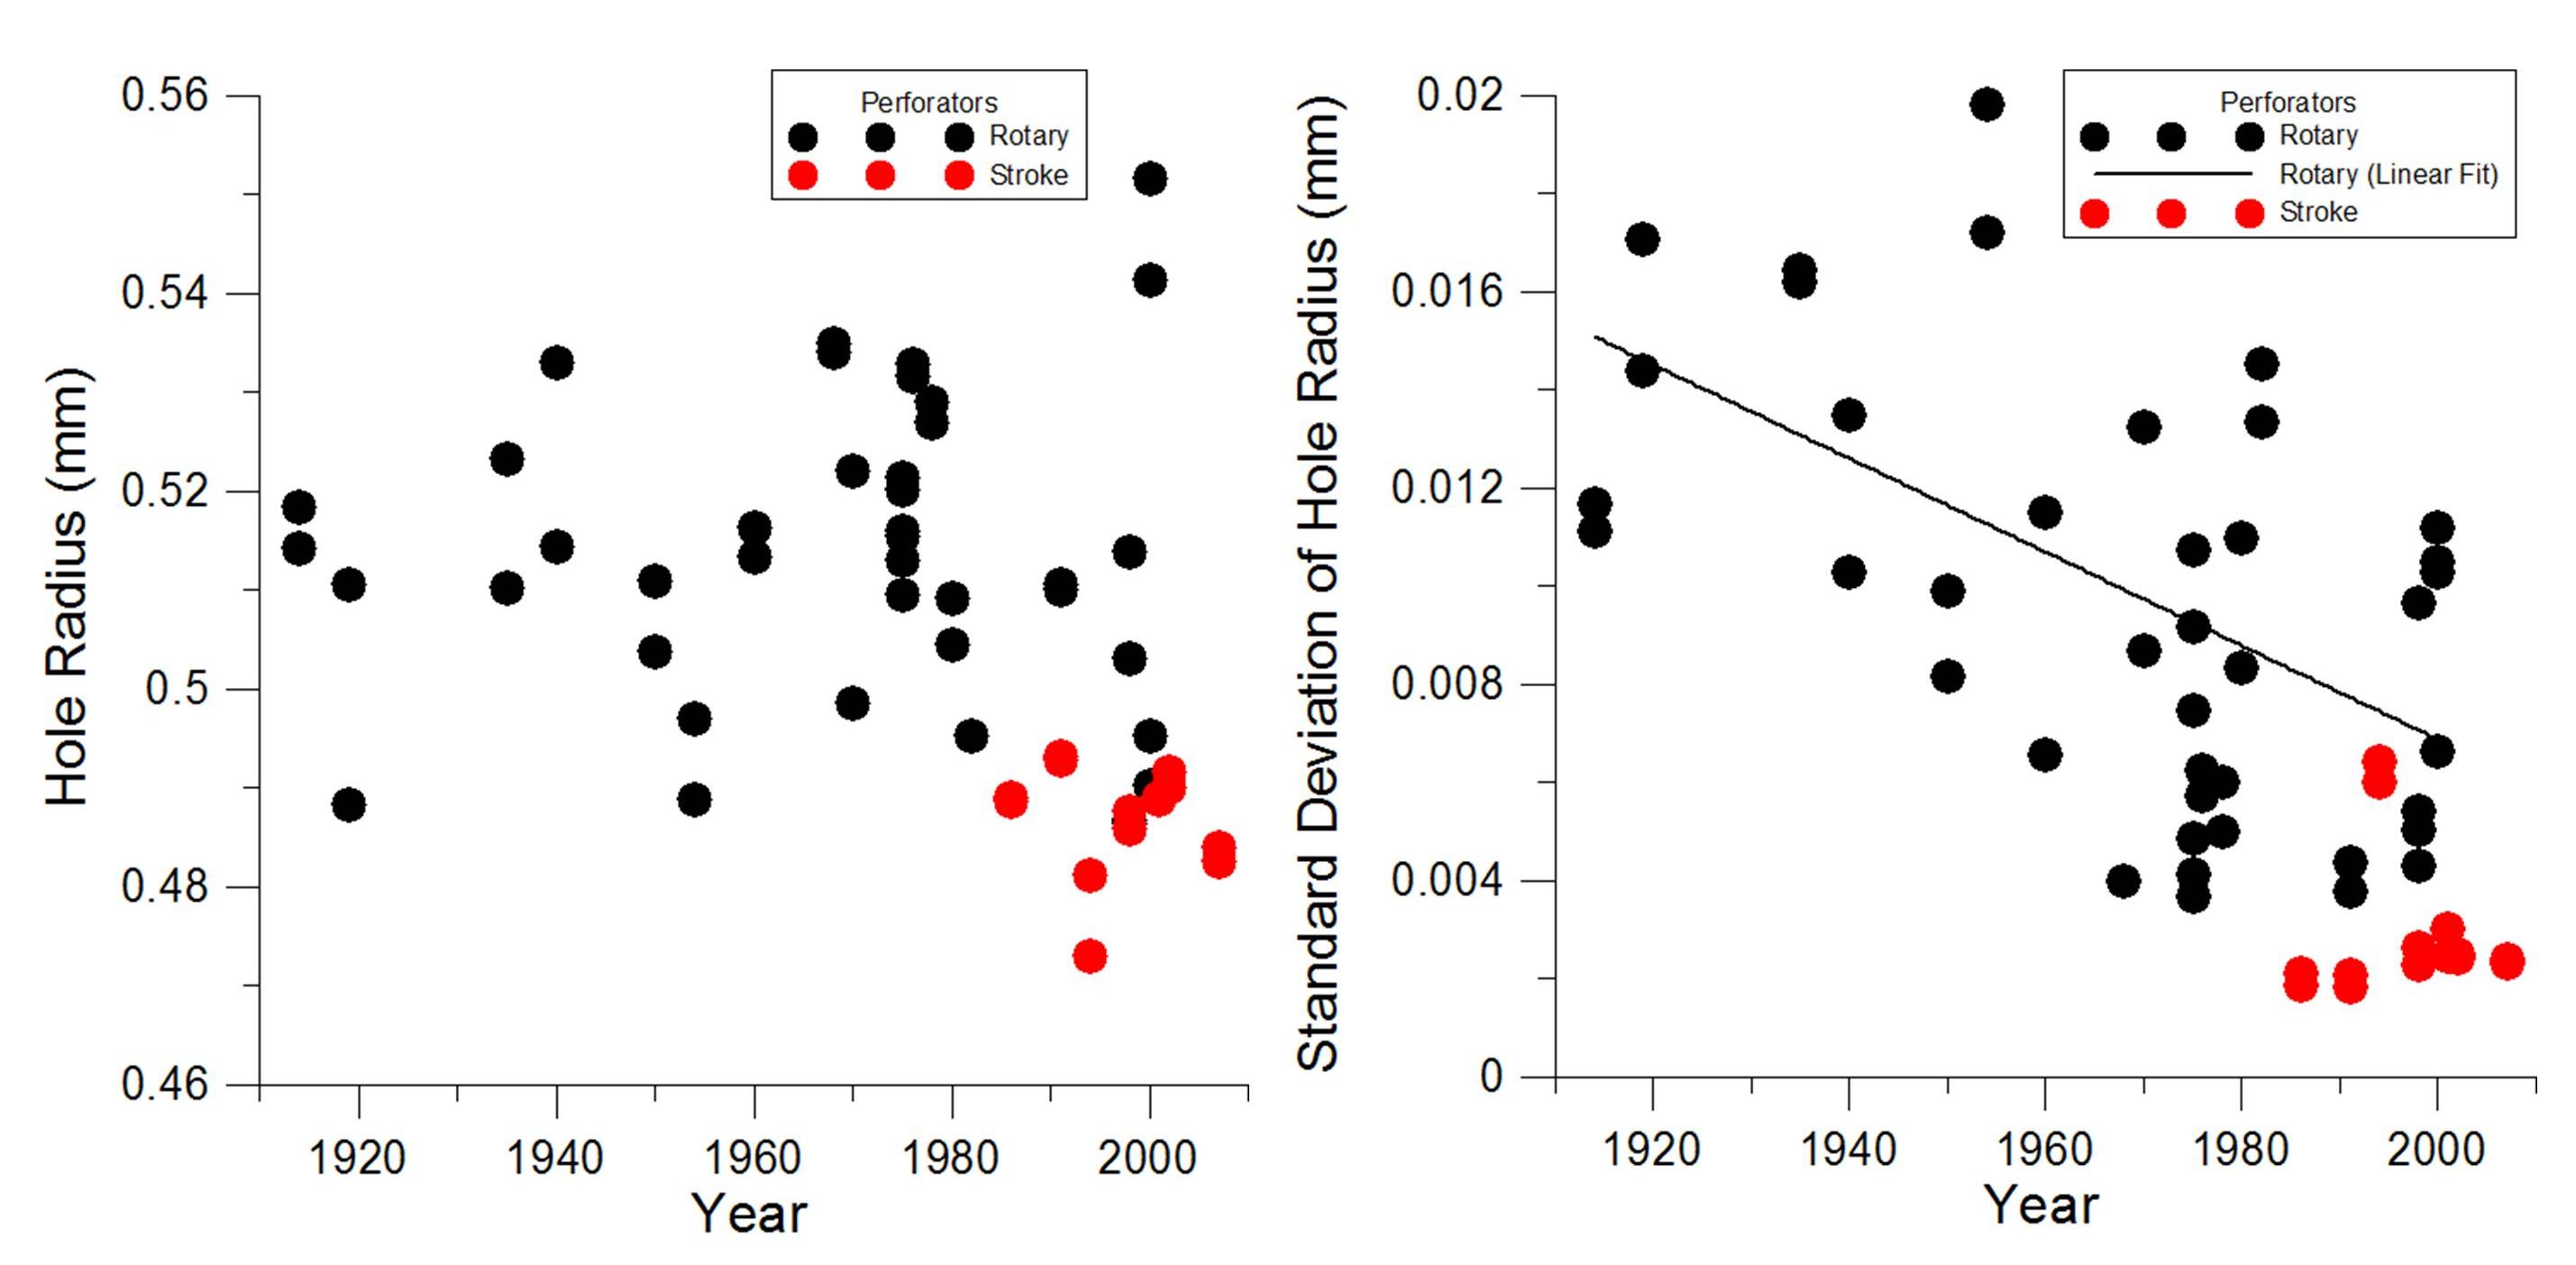
Figure 6. Plots of the perforation hole radius and its standard deviation over the last century. While the hole radius has remained relatively constant with rotary perforation, the typical size is larger than the hole sizes measured for stroke perforation. Reduction in the radius deviation is expected from the improvements in machining tolerances.
The standard deviation of the hole radii produced by rotary perforation shows on average a gradual decline over the century, likely the result of steady improvements in the manufacture and perhaps maintenance of equipment. There are no sudden improvements, as there was following the NBS program in the early 1980s. The hole fit error (HFE), indicative of the sharpness of the hole cut, also improved gradually over the century as shown in Figure 7(a). It probably benefited from gradual reductions in pin-to-hole clearances, owing to improved positional accuracy in machining. The stroke perforators mostly have lower and similar HFE values. By their very design, the accurate positional drilling of a smaller array of holes on a flat sheet should be a faster and less demanding task, so it is perhaps not surprising to see the data for stroke perforators tightly clustered. Specification of current Wista stroke perforation products quote perforation and repeating accuracies of ±0.001 mm. [9] This is significantly lower than the least positional variation observed in Figure 5, but other variables such as changes to the paper may contribute to the minimum variance that may result in finished stamps.
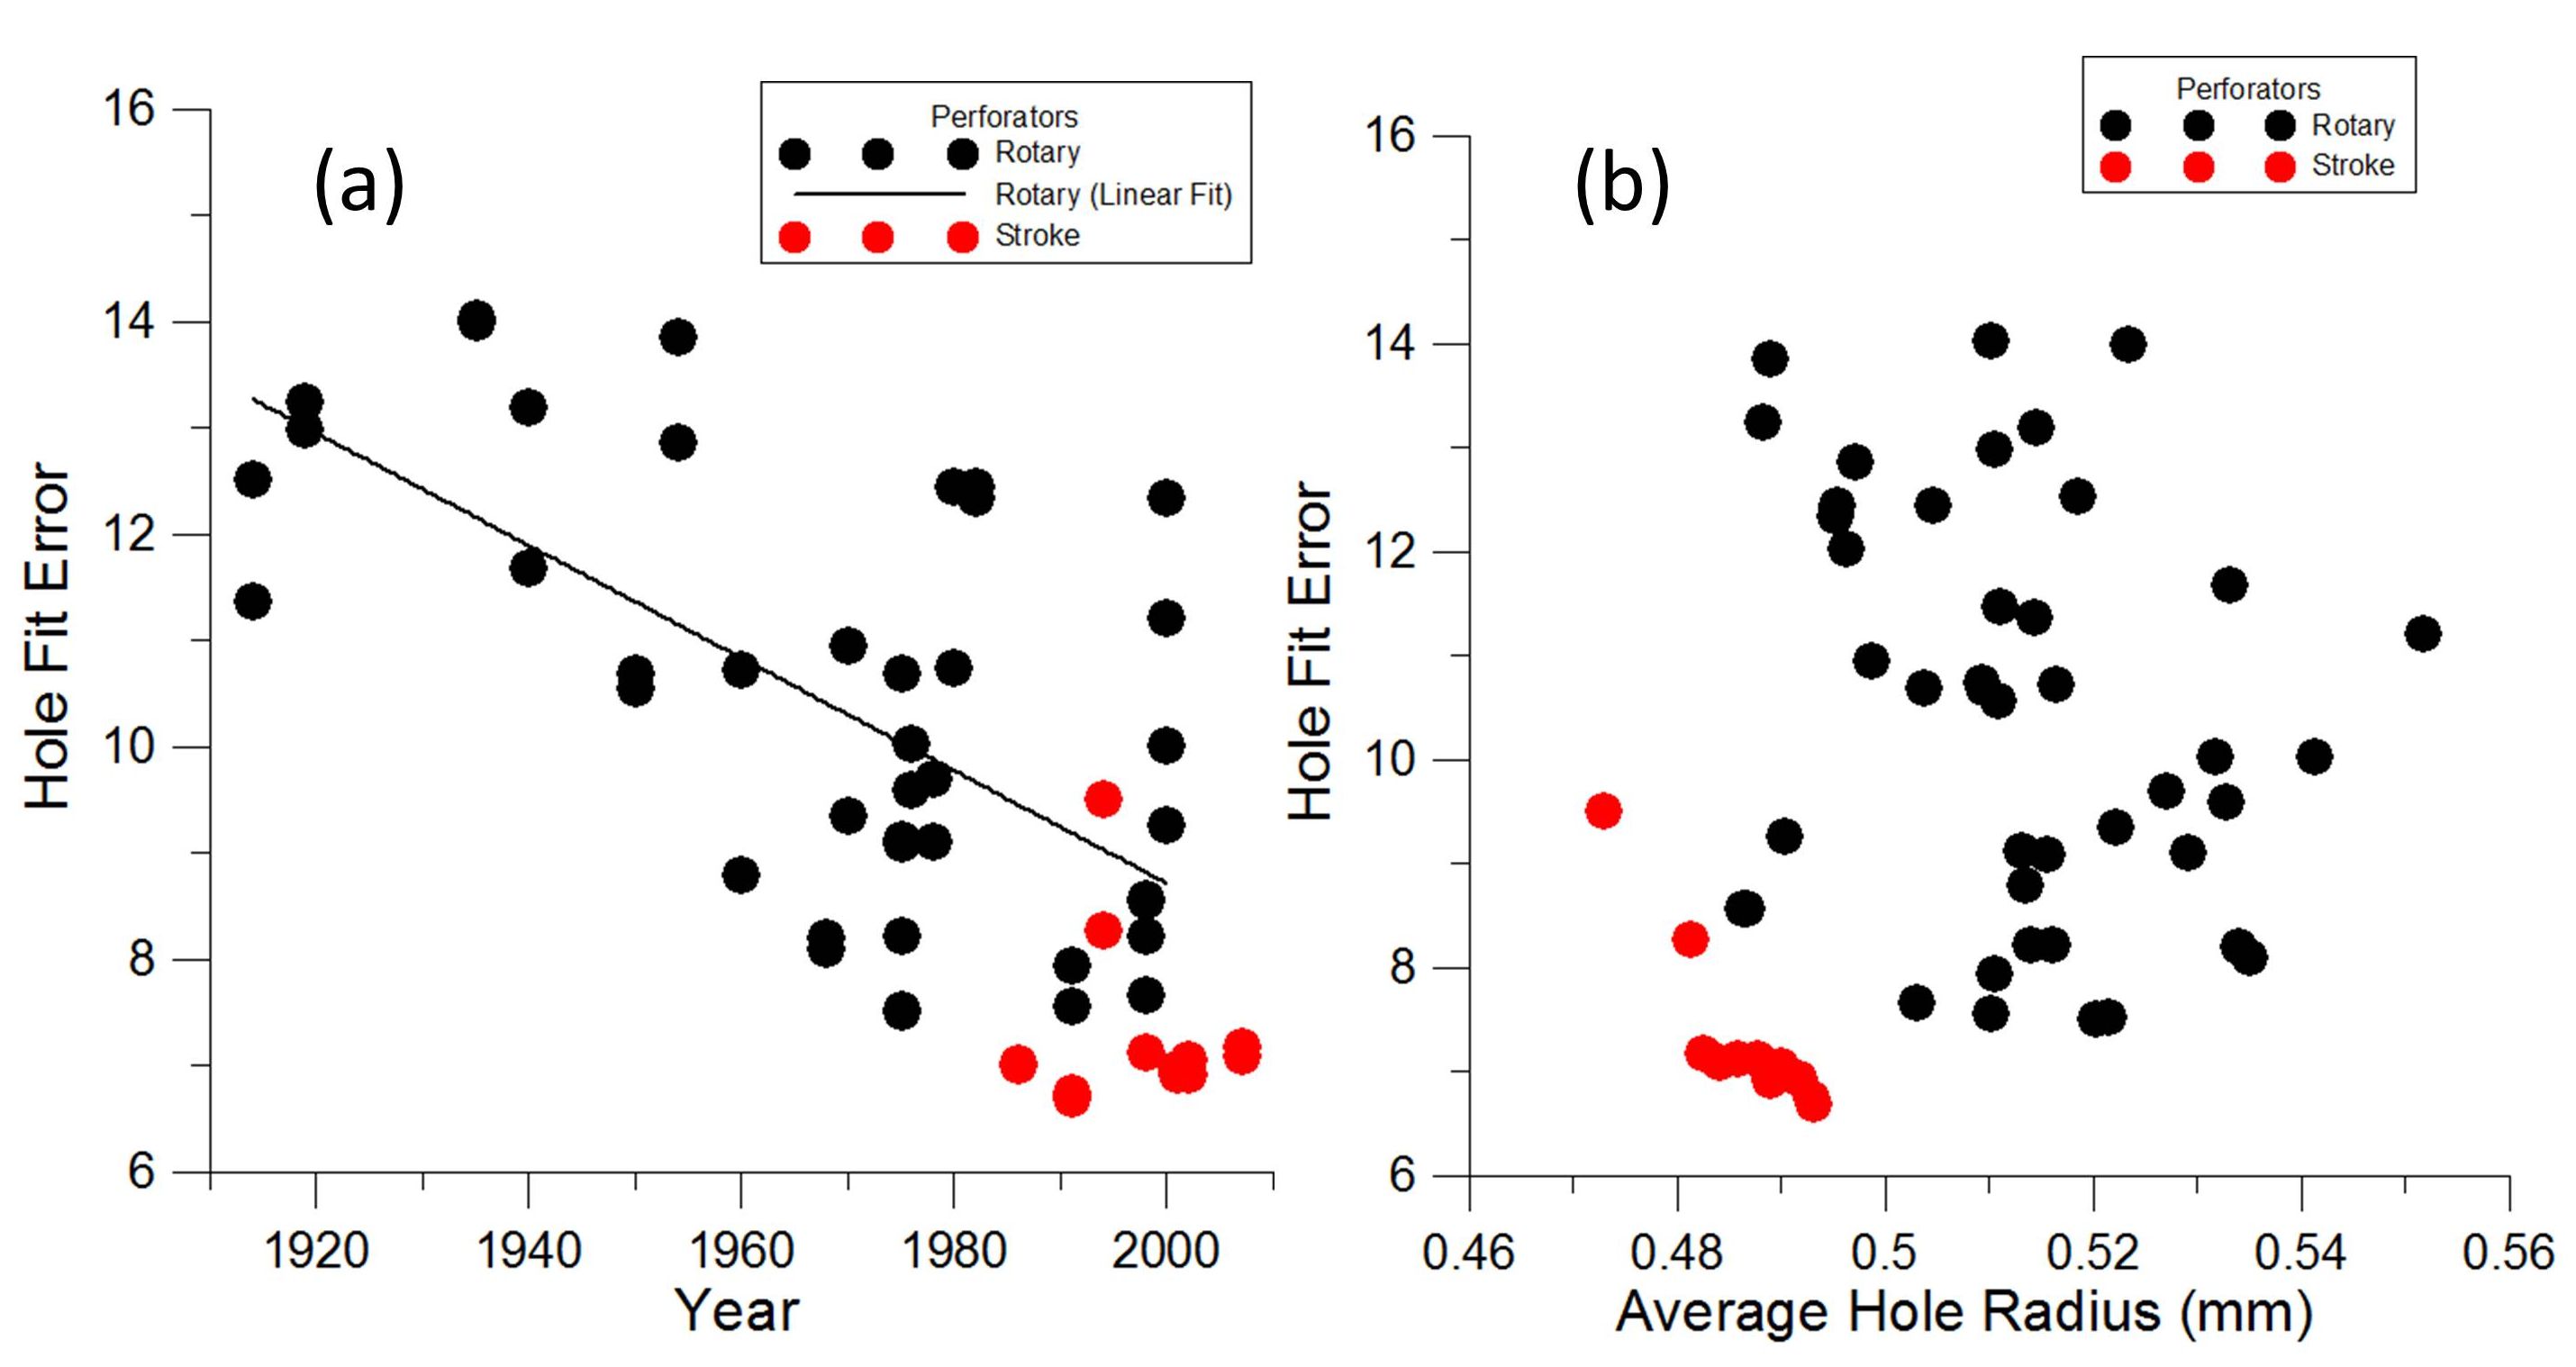
Figure 7. The reduction in the hole fit error reflects the gains realized in smaller machining tolerances. The stroke perforations analyzed in this study have a combination of smaller hole size and more perfect hole cut.
Figure 7(b) shows that the data for stroke perforations clusters together when hole radius and HFE are plotted together. The studied stroke perforations have a unique combination of sharp hole cuts combined with their small hole sizes.
Statistical Analysis of Re-Perforations
Statistical analysis of perforations can reveal anomalies in stamps suspected of re-perforation. Typically, the characteristics of perforations on opposite sides of stamps should be most similar as these normally match in gauge and are done by the same perforator. One can readily analyze most undamaged stamps in this way.
Using pairs of plots similar to the ones presented in the previous section, Figure 8(a) shows an example of a three cent U.S. parcel post stamp for which the right edge perforations have anomalous characteristics. While the other three edges’ characteristics appear to have similar distributions, the right edge has narrower distributions of the radii, hole spacings, and HFE. The average value of the HFE for the bottom edge is also much smaller. These anomalies suggest re-perforation of the right edge.
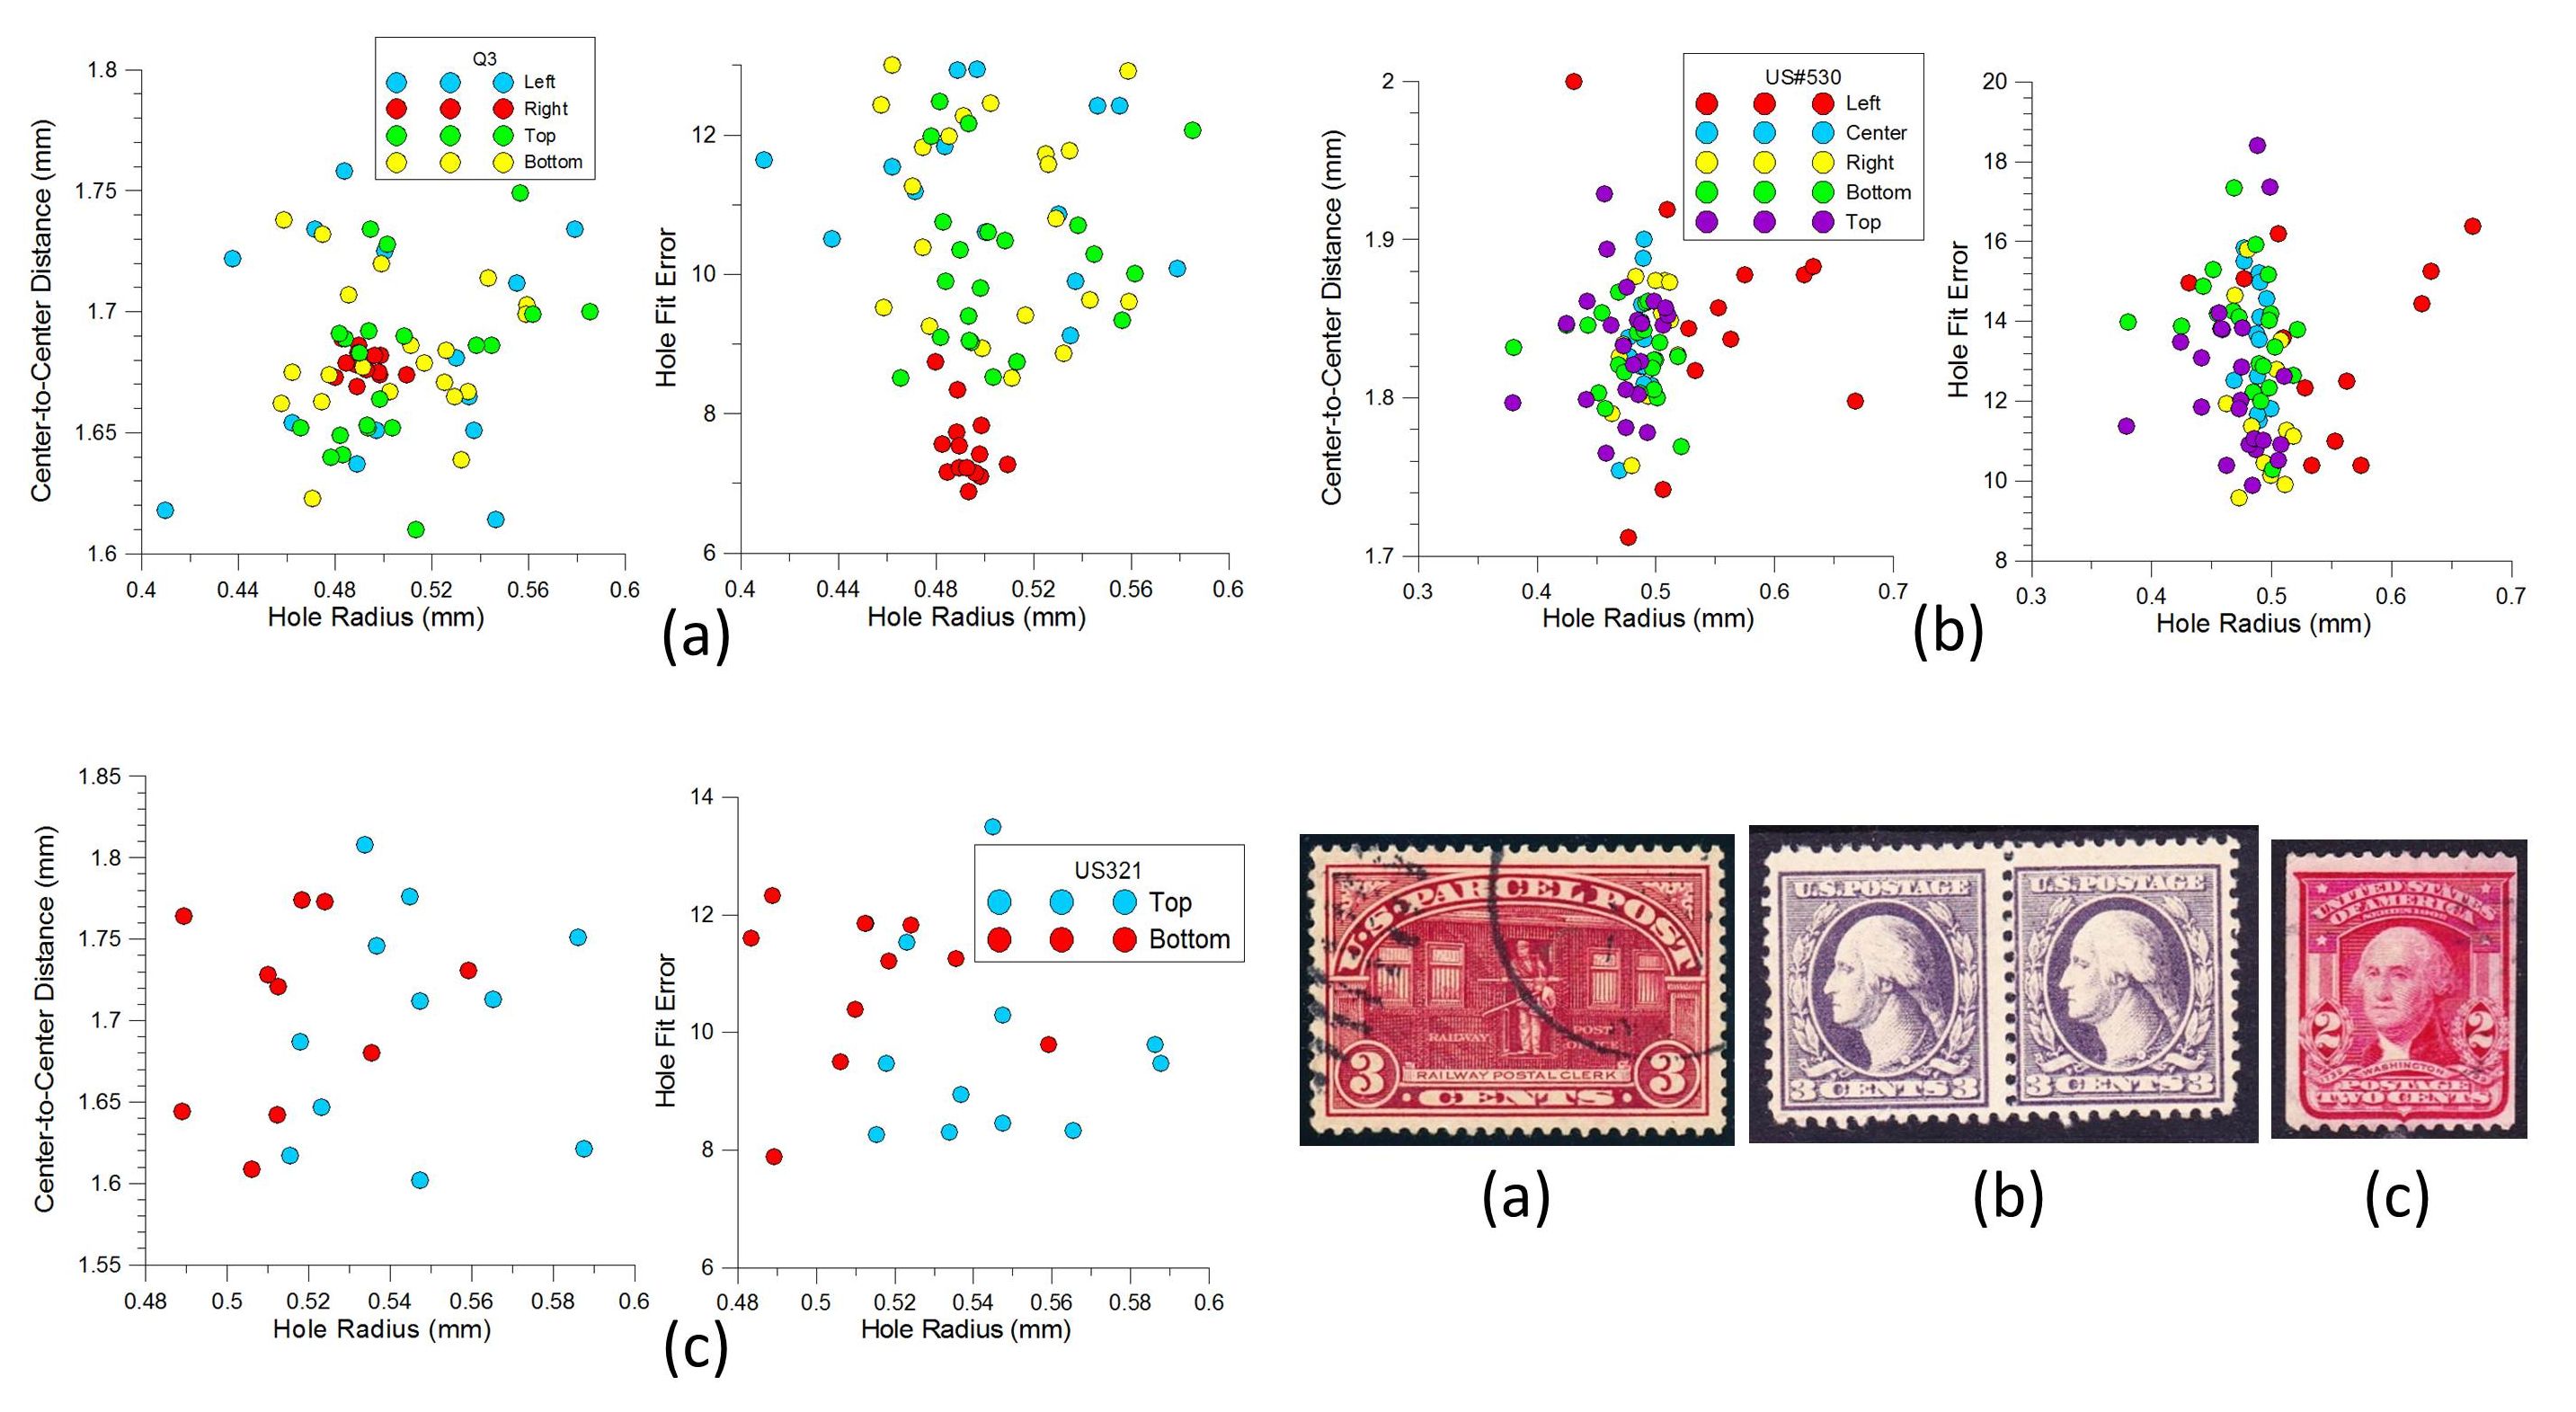
Figure 8. Similarly constructed plots comparing the edges of the same stamp for uncharacteristic or greatly differing perforation properties. The three illustrated stamps display the following anomalies: (a) the distributions for the right edge are uncharacteristically narrow with a too perfect cut; (b) the left edge has too wide a range of radii; and (c) the two edges have greatly different distributions of hole radii.
The next example for the three cent Washington third Bureau issue in Figure 8(b) displays anomalous hole sizes for the left edge perforations. The other three edges have very similar characteristics, and all edges have similar gauge measurements. However, the distance between the vertical rows of perforations for the stamp on the left is 1.5 mm wider. This suggests that a margin with a straight edge was probably re-perforated on the left stamp.
One final example shows what is a likely re-perforated stamp to imitate a 1908 two cent Washington coil rarity. The distributions in Figure 8(c) for the top and bottom edge radii poorly match. The poor matches lead one to believe that this stamp was probably an imperforate variety of this stamp with trimmed sides and added perforations at the top and bottom.
Fingerprinting Stroke Perforations
My original investigation of 19th century revenue stamps with perforation forgeries pointed to the use of a stroke perforator. I developed image analysis methods for this project to detect perforation fingerprint patterns (Mustacich, 2014). Stroke perforations lend themselves very well to fingerprinting because of the large amount of repetition of the imperfect pin spacing pattern peculiar to the perforator. Regarding the different examples in Table 1 of stroke perforations, these all are amenable to fingerprinting. Because they all fingerprint in similar ways, one example is sufficient to demonstrate the general approach.
Comb perforation is a type of stroke perforation frequently encountered in which one or more rows are punched in a sheet at a time, each with a “comb” of rows at right angles. Figure 9(a) shows the sequence of a 2-hop comb by a Wista stroke perforator on an example sheet of the U.S. 2007 Flag stamps (Scott no. 4129). The comb pattern is shown at the right. The 10x10 sheet of stamps has eleven vertical rows of perforation, so six uses of the comb are required, with one use partially off the cut sheet. The small inconsistency in the perforation spacing where successive comb patterns meet indicates that the right edge vertical row on the sheet corresponds to the vertical row of the comb labeled “1.” Consequently, the vertical comb hole-spacing pattern “1” repeats itself on the sheet six times as illustrated across the sheet, and vertical comb pattern “2” repeats five times.
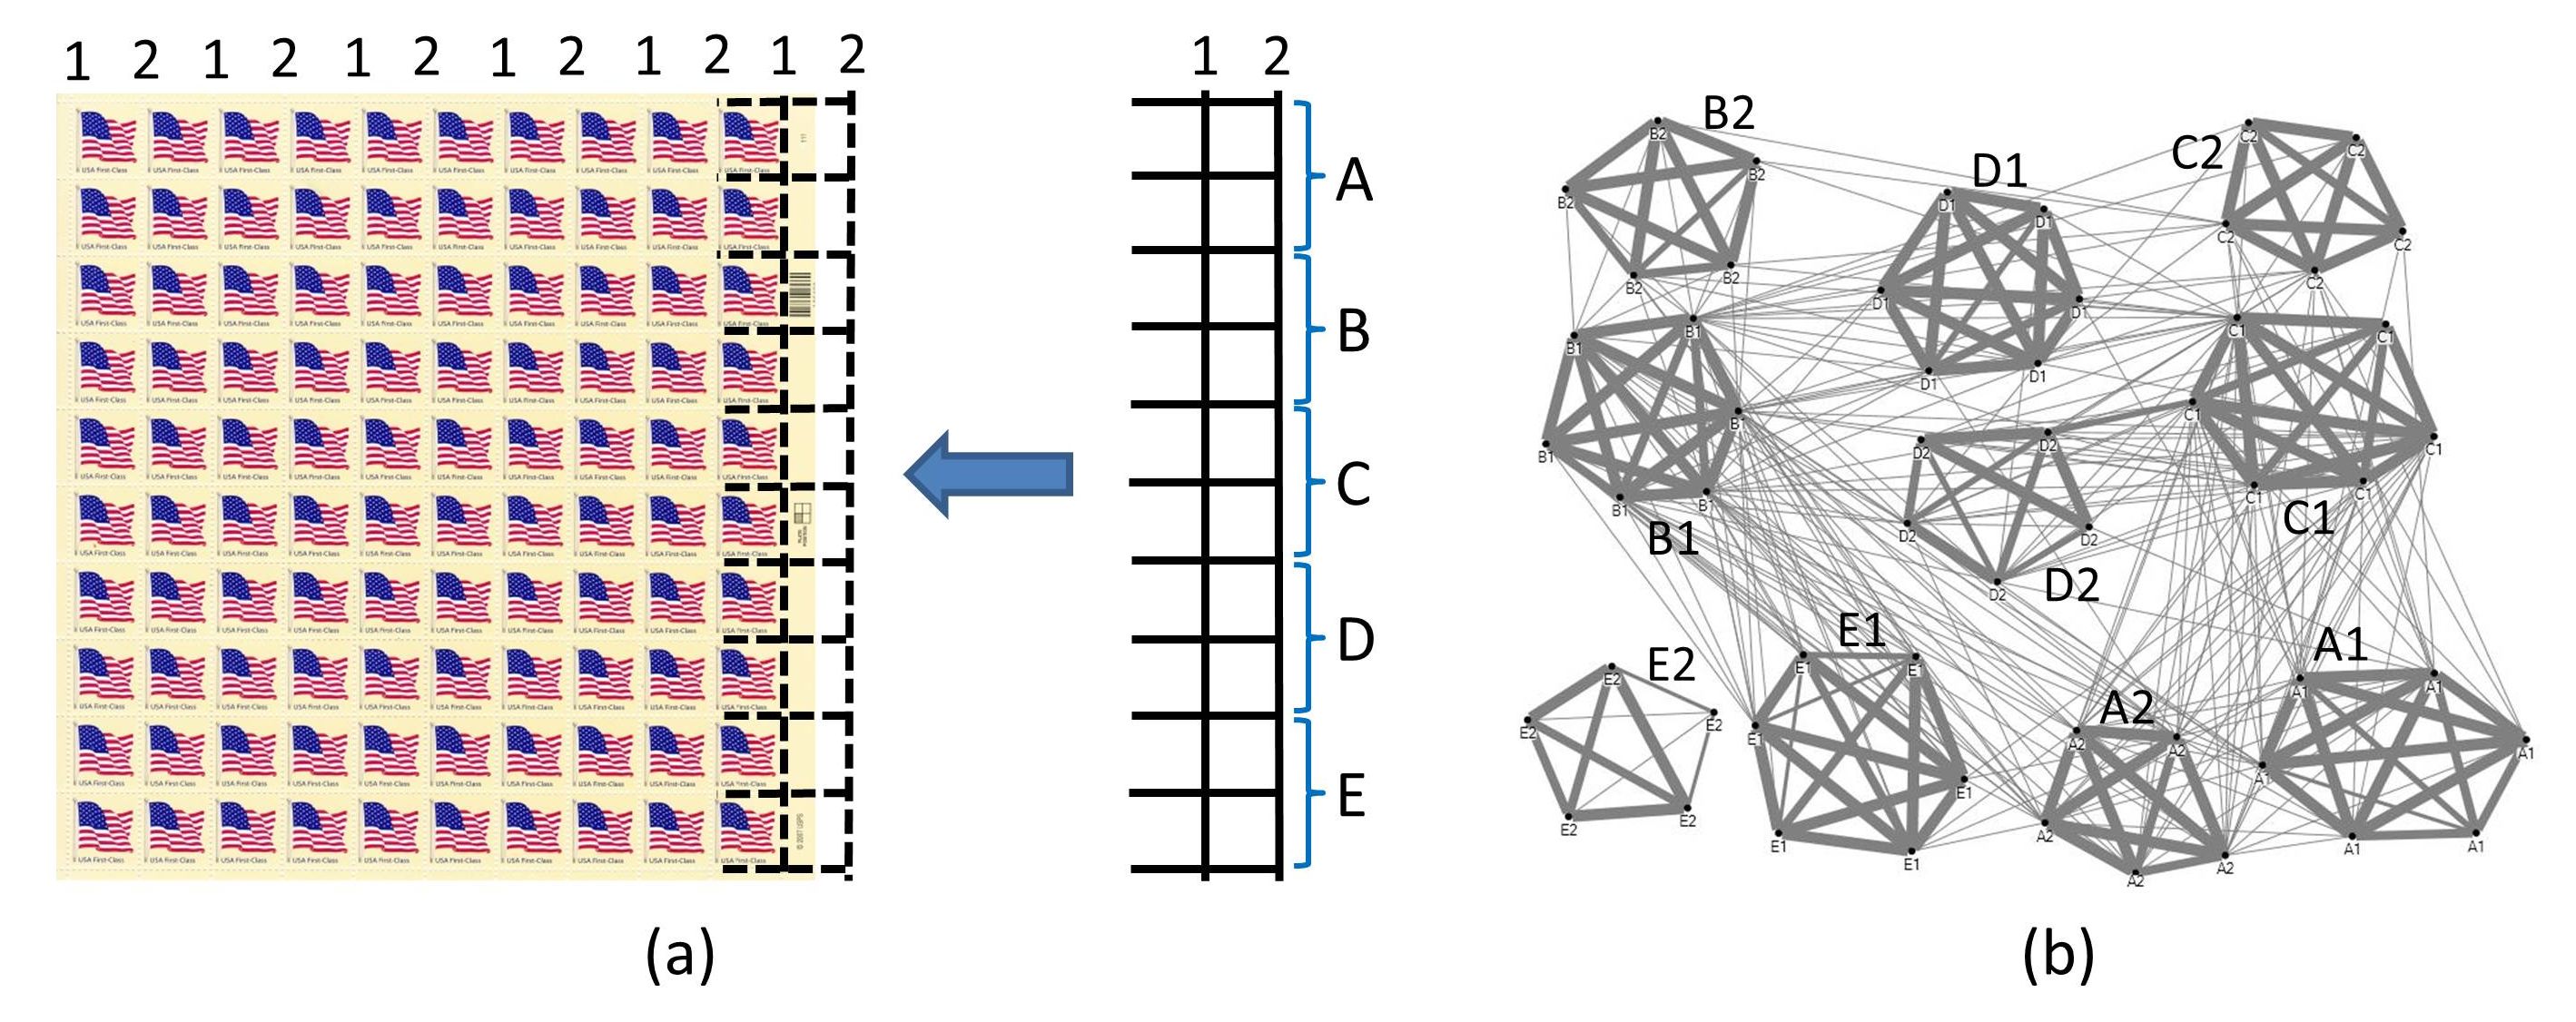
Figure 9. A sheet of the 2007 Flag Issue showing the travel of the 2-hop comb in (a) used to stroke perforate the sheet. All of the vertical perforations were scanned in five sections, A-E. The repetition of the comb should result in 6 strikes of the comb’s column 1, and 5 strikes of the comb’s column 2 for each of the sections. Fingerprinting using the imperfections in hole spacing correctly matches up the 55 segments as shown by the clusters of matching fingerprints (wide lines indicate very strong fingerprint matches) in (b).
The vertical perforations were scanned in 5 sections labeled A-E, a total of 55 images. The hole spacing patterns from the images should match up as 5 groups of 6 patterns, and another 5 groups of 5 patterns.
After analyzing and fingerprinting hole spacings for the 55 images, a computer tested all possible alignments of the patterns. Each possible alignment of a pair of fingerprint patterns is given a score equal to n/∑|ai - bi-j|, where n is the number of overlapping hole spacings, and ai and bi are the sequential hole spacings of the fingerprints, and j is a varying offset as the overlap is shifted to determine the best matching. A minimum overlap of 8 components was required to avoid large matching scores from coincidental matches with very short overlap sequences. Including the factor of n in the matching score introduces a modest weighting that favors more fingerprint overlap, and small total differences in the denominator with good matches result in high values for the score. Using a threshold for the score, higher values are passed to a program to plot the network of matches.[10]
Figure 9(b) presents the network graph for the fingerprint matches. The figure includes matches with scores exceeding the threshold. The points in the figure represent fingerprints, each labeled to identify which section of the row of perforations it belongs to. Lines connecting the points represent fingerprint matching scores which exceed the threshold, wider lines representing much higher scores. As is visually evident in the network graph, the strongest matches define a set of 6 matching fingerprints and a set of 5 matching fingerprints for each row A to E. Nearly all of the strong correlations in the graph are with their own group. Because the modern perforations are relatively precise in their pin spacings, the general similarity of fingerprints results in a moderate amount of background correlation shown by the fine lines. Less perfect, older perforation equipment allows the use of lower thresholds with greater rejection of coincidental background correlation because the typical fingerprints differ much more. Nonetheless, higher thresholds can be used with more perfect perforation equipment as in this example to extract the networks from the fingerprint data and apply fingerprinting to modern stamps.
Measuring Other Types of Stamp Separation
The image analysis methods can be adapted to the analysis of other types of separation such as roulettes and die cuts. The linear algebraic methods for fitting circles to data apply as well to the arcs in the peaks and troughs of wave-like images.[11] Good fits of partial circular arcs to the turning points of wave-like profiles then defines the periodic spacing of the wave peaks and troughs, the approximate width and shape of the wave extremes, and the crest-to-trough height, or “amplitude,” of the wave. The individual data for each peak and trough also provide measures of the variability of these quantities, and their sequences can provide fingerprinting information. The following two examples illustrate such measurements with both old and new stamps having wave-like edges.
The early stamps of Finland offer many examples of serpentine roulettes that were hand cut with tools consisting of a handle with a cutting wheel (Linder and Dromburg, 1983). Small paper bridges were left uncut to keep the stamps from fully separating. Rouletting wheels were individually crafted and maintained; consequently, there is a large variation in the rouletted separations found on these stamps. Both postage stamps and revenue stamps were rouletted in this manner. Analysis of the shapes from an edge of a 19th century 20 pennia Finland revenue stamp is shown in Figure 10(a). The images were scanned and pre-processed in the same resolution and manner as described above for the perforation images. While the modern die cut stamps are very regular, the early Finnish roulettes require some special considerations. Irregularities are common in the area of the paper bridges that have been torn away in the separation. The algorithms for sequential analysis of the features in the entire image also need to accommodate the frequently missing “teeth” in the study of these stamps. Additionally, all of the rouletting of these stamps has slight curvature, and the images must be corrected so that the peaks and troughs can be accurately described without distortion from this curvature.
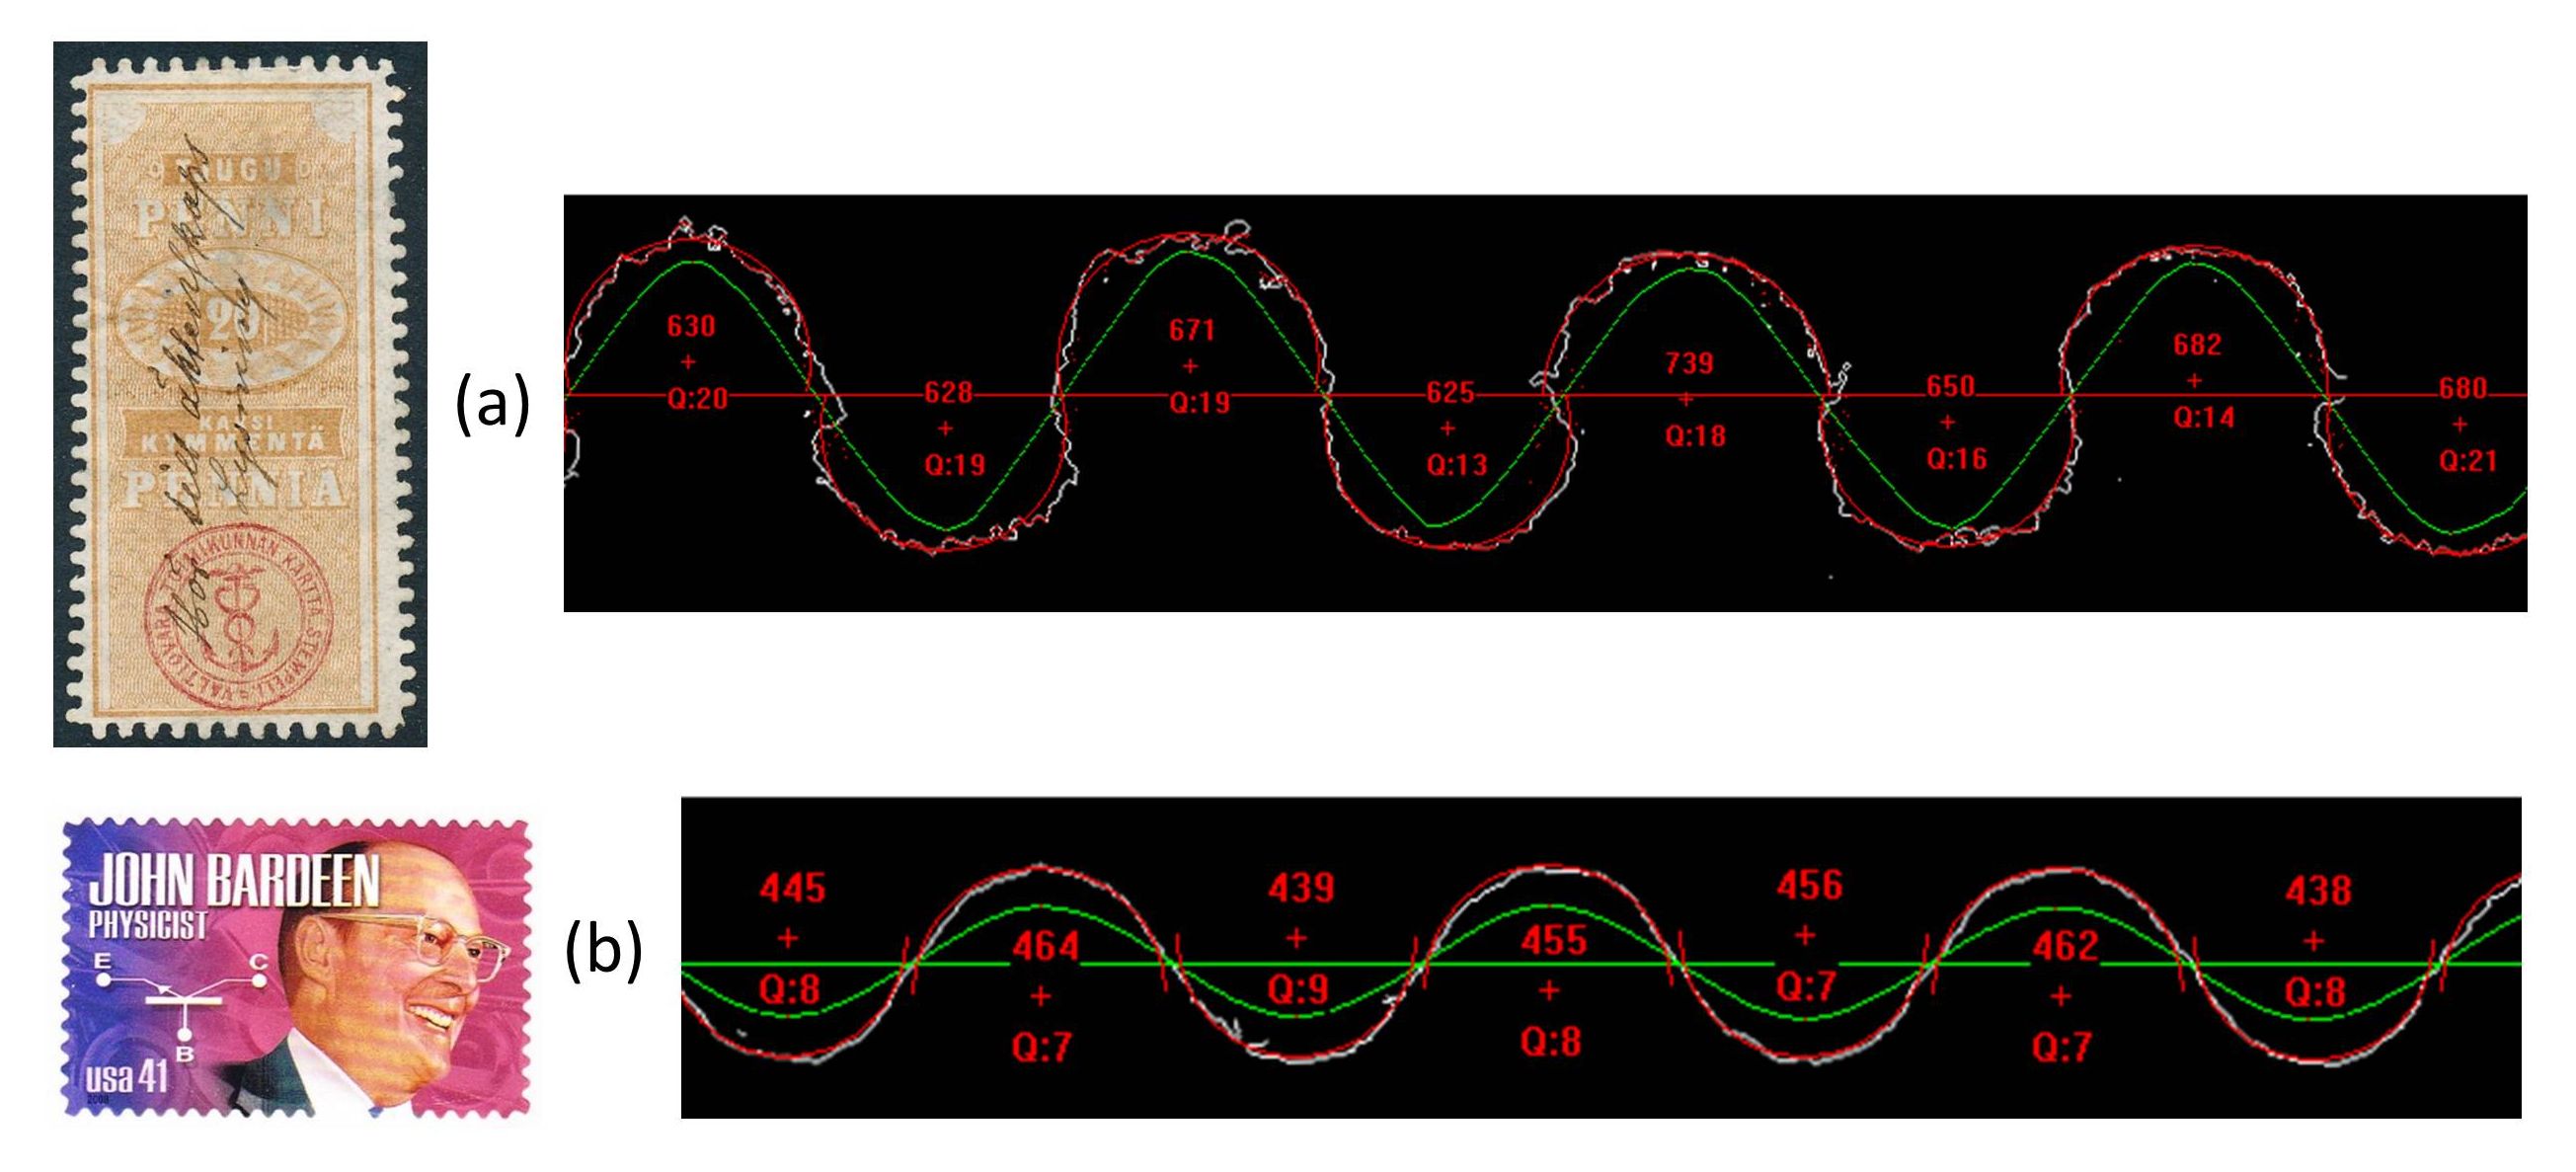
Figure 10. Two examples showing a modification of the methods for the analysis of other types of stamp separation profiles. The early Finland revenue stamp has long, sometimes interlocking roulettes, while the modern die-cut example has a very regular profile. The same curve-fitting routines can be applied with partial arcs to the tops and bottoms of the edge profiles to characterize the shapes, peak-to-trough “amplitudes,” and the roughness of cut.
The removal of any overall curvature of the roulettes was accomplished by fitting the entire length of the roulette to a parabola, which consists of three terms. The small quadratic term corrects for curvature, the linear term corrects for tilt of the roulette in the image, and the constant term centers the roulette in the image. In the next step, a smoothed view of the roulette using a centered average, shown in green, is calculated to obtain an indication of the presence of a peak or trough in the roulette, and the approximate location of these features. This greatly simplified the challenge of properly locating and launching the circle fitting routines. These routines were constrained to fit partial arcs only to the peaks and troughs of the roulette raw data and avoid the bridged areas in the middle of the roulette. The best fit partial arcs are shown as full circles (drawn in red) truncated at the center line through the roulette. The radius of the best arc fit is shown in red (in µm) near the red cross, which shows the location of the center of the fitted arc. These locations, combined with the arc radii, give a direct measure of the amplitude of the wave form. The peak-to-peak or trough-to-trough distances then define the gauge of the roulette. The individual values provide statistics for the roulette. In this particular example, the gauge using either the peaks or the troughs is 7.78. The average radius for the arcs fit to the peaks is 670 ± 38 µm, and for the arcs fit to troughs is 659 ± 42 µm. The average offset for the arc centers from the center line is 131 ± 77 µm for the peaks, and -112 ± 64 µm for the troughs. The average value for the amplitude of the roulette is 1.57 ± 0.12 mm. The HFE calculations applied to these partial arcs give average errors of fit of 17 ± 3 and 18 ± 3 for the upper and lower arcs, respectively. The results cluster into several types described in the literature (Linder and Dromburg, 1983). The author plans to do additional work on the relations of the fingerprints of these roulette patterns.
The same program can analyze the edge profiles of modern U.S. die cut stamps. Figure 10(b) shows the analysis of an edge from the 2008 John Bardeen stamp. The modern die cut edges are very smooth and the wave-like features are well represented by fits to partial arcs of a circle. In this example the gauge is 10.81, and the average amplitude is 700 ± 11 µm. The average radius for the arcs fit to the peaks is 459 ± 8 µm, and 443 ± 8 µm for the arcs fit to the troughs. The average offset for the arc centers from the center line is -111 ± 13 µm for the peaks, and 90 ± 12 µm for the troughs. Because of the smooth nature of the die cuts, the average HFE values are 8.7 ± 1.0 for the peaks, and 8.3 ± 0.5 for the troughs. The small deviations in the different parameters show that the die cuts are made to excellent precision and can be precisely described. Tests of other U.S. die cut stamps show that there is a large range of these edge profiles.
Conclusions
The image analysis of perforations to determine statistical characteristics for an entire sheet of stamps reveals the quality improvement over the history of rotary perforation. Two steps in the improvement are observed, and these correspond with documented advances to achieve smaller tolerances in the machining of perforators. The analysis techniques show large differences between the characteristics of different types of rotary perforation and stroke perforation that were used in U.S. stamp production. The same analysis techniques can be applied to single stamps to detect anomalies that often can be expected with re-perforation. Imperfections in pin spacing which appear repeatedly, such as by stroke perforation, provide a method to fingerprint certain perforations. Also, modified methods can perform similar analyses of other types of stamp separation. Examples using the same circle-fitting methods, but with partial arcs, demonstrate that roulettes and serpentine die-cuts can also be described in terms of the shapes of their features, their peak-to-trough amplitudes, and their roughness of cut.
Acknowledgements
Thanks to Ken Lawrence for many valuable discussions and review.
References
Bergstrom, R. P. 1984. Drilling Precision Stamp Cylinders at the NBS. Manufacturing Engineering 92 (4): 76-79.
Coope, I. 1993. Circle fitting by Linear and Nonlinear Least Squares. J. Optimization Theory and Applications 76: 381-388.
Hotchner, J. M. 1989. The Perforating of United States Postage Stamps. The United States Specialist 60 (6): 288-294.
Kitson, R. E. 1988. Perforation Varieties on Recent U.S. Issues. The United States Specialist 59 (1): 27-34.
Leavy, J. B. 1918. Fake Perforations. The Philatelic Gazette, May: 154-155.
Linder, L., and Dromberg, D. A. 1983. The Serpentine Rouletted Stamps of Finland Issues of 1860 and 1866 . Translation from The Handbook of Finnish Stamps. The Scandinavian Philatelic Foundation, Thousand Oaks, CA. p. 30.
Mustacich, R. 2014. Freak or Fake? A New Fingerprinting Method for Distinguishing between Original and Fraudulent Extra Perforation of 19th Century Revenue Stamps. The American Revenuer 67 (1): 2-19.
Mustacich, R. 2015. Fake Perforations on 19th Century U.S. Revenue Stamps: A Stroke of Luck. The American Revenuer 68 (4): 2-8.
Myall, D.G.A. 2003. The complete Deegam Machin handbook, 3rd ed. Bridport, Dorset, England, p. C7-5.
National Insitute of Standards and Technology, 2001. Automating the Future, A History of the Automated Manufacturing Research Facility 1980-1995 . NIST Special Publication 967. National Institute of Standard and Technology, Gaithersburg, MD.
U.S. Bureau of Engraving and Printing, 2013a. U.S. Dept. of the Treasury. Reprinted private communication dated July 4, 1964, original recipient redacted.
U.S. Bureau of Engraving and Printing, 2013b. U.S. Dept. of the Treasury. Keeping Holes in Line for the Bureau of Engraving and Printing. A communication to the BEP from Mr. Baker of Harris Seybold Co. dated October 23, 1951.
Weiss, L. S. 1994. Perforation Measurement and Scott #544. In Perforation Measurements of United States Stamps, Bureau Issues Association, Inc., Reprint Series No. 2, Bellevue, IL, pp. 6-13.
Williams, L. N., and Williams, M. 1971. Fundamentals of Philately. American Philatelic Society, State College, PA, pp. 514, 536, 540.
[1] Example modern continuous gauges are the Instanta Gauge (Stanley Gibbons, London, UK), the Precision U.S. Specialty Multi-Gauge (Sonic Imagery Labs, Castro Valley, CA), and the high accuracy BSG gauge no longer in print (1948 Buildings Study Group of the German Philatelic Society, produced by Eastman Kodak, Rochester, NY).
[2] An example is the PERFOtronic (Safe Stamp and Coin Supplies, Thunder Bay, Ontario, Canada).
[3] Some examples of software to measure perforation gauge are EzPerf (SoftPro 2010 Inc., Sault Ste. Marie, Ontario, Canada), ePerforationGauge (Peter Hek, Castricum, The Netherlands), and PERFOmaster 3000 (Hermann Bux, Adelzhausen, Germany).
[4] This study included a block of 120 of the 1862 1 cent Proprietary revenue stamp.
[5] A variation of the use of 1-way perforators was to automate the work flow between two perforators so that a sheet travels at 90 degrees from the first machine to then perforate it in the second direction. This combination of perforators and work flow, termed an “L” perforator, produced the 1957 4c “Flag Issue,” for example.
[6] There is a conflicting date in the accounts which cites 1979 for one of the members joining a research group in the project, but perhaps this member was not a part of the initial pilot effort. There are also factual conflicts in the descriptions of the same events from the two different references. Both references rely on personal interviews and recollections of the events.
[7] My investigations of effective hole size by machining punches using replacement perforator pins shows that holes tend to slightly smaller sizes than the pin size, by about 1-4% depending on factors such as the stiffness of the paper and the clearance of the pin in the hole. Small clearances and stiff paper result in hole sizes closer to the pin size. Soft paper or large clearances appear to allow stretching of the paper before the pin bursts through the paper, and the relaxation of the paper results in a smaller effective hole size (Mustacich, 2015).
[8] The size of pins examined in some early manual stroke perforators made in the U.S., such as by the Rosback Co., measure 0.0395 inches in diameter (1.00 mm), and these measurements match exactly the measurements of replacement pins supplied by Rosback for these early perforators. These old machines also punch holes undersized by 1-4% depending on how they are used (Mustacich, 2015). Other Rosback Co. product pin sizes are also known to exist such as modern philatelic labels perforated on Rosback equipment with ̴ 1.10 mm radius (The Olathe Poste, Olathe, CO).
[9] Current specifications for WS 90-V, WS 90-H, and WS 90-VA perforators (WISTA GmbH, Schwaigern, Germany).
[10] The NodeXL software extension to Microsoft Excel was used for the network graphing. NodeXL is a product of The Social Media Research Foundation, www.nodexl.codeplex.com , NodeXL Excel Template, version 1.0.1.245, June 19, 2013.
[11] The literature descriptions of roulette features have confusing uses of the terms height, width, length, etc. Descriptions of roulettes and similar shapes in philately would be more consistent if philatelists adopted the modern terms used to describe the basic features of waveforms.